The median household income in Oakland, TN in 2022 was $88,078, which was 25.9% greater than the median annual income of $65,254 across the entire state of Tennessee. Compared to the median income of $51,823 in 2000 this represents an increase of 41.2%. The per capita income in 2022 was $39,123, which means an increase of 50.5% compared to 2000 when it was $19,365.
Whole page based on the data from 2000 / 2022 when the population of Oakland, Tennessee was 1,279 / 9,307
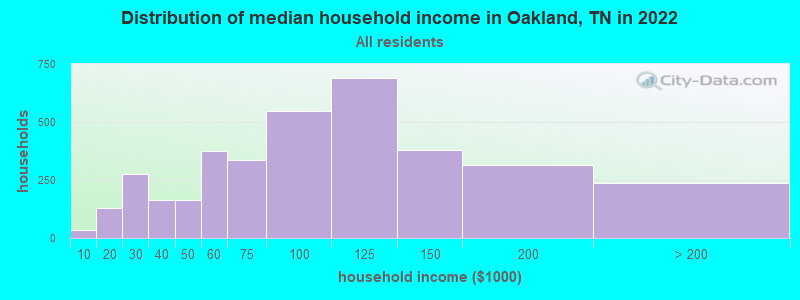
Income statistics for all residents
Median household income in Oakland, TN in 2022:
Oakland:
$88,078
Tennessee:
$65,254
Change in median household income between 2000 and 2022:
Oakland, Tennessee:
+70.0%
State:
+79.5%
Number of households with income < $10k:
Oakland:
0.9% (33)
State:
5.4% (154,793)
Number of households with income $10k - 20k:
Oakland:
3.6% (131)
State:
8.0% (228,599)
Number of households with income $20k - 30k:
Oakland:
7.6% (277)
Tennessee:
7.9% (224,908)
Number of households with income $30k - 40k:
Oakland:
4.5% (163)
State:
8.6% (244,297)
Number of households with income $40k - 50k:
Oakland:
4.5% (164)
Tennessee:
8.4% (238,949)
Number of households with income $50k - 60k:
Oakland:
10.3% (376)
State:
7.7% (218,438)
Number of households with income $60k - 75k:
Oakland:
9.2% (336)
State:
10.3% (294,172)
Number of households with income $75k - 100k:
Oakland:
15.0% (548)
State:
13.3% (377,310)
Number of households with income $100k - 125k:
Oakland:
18.9% (688)
State:
9.5% (269,124)
Number of households with income $125k - 150k:
Oakland:
10.4% (380)
State:
6.3% (178,328)
Number of households with income $150k - 200k:
Oakland:
8.6% (315)
Tennessee:
7.2% (204,030)
Number of households with income > $200k:
Oakland:
6.5% (238)
State:
7.5% (213,736)
Aggregate household income in Oakland in 2022: $360,250,181
Median family income in Oakland in 2022:
Oakland:
$98,553
State:
$80,910
Number of families with income < $10k:
Oakland:
1.3% (36)
State:
3.9% (72,917)
Number of families with income $10k - 20k:
Oakland:
0.4% (11)
Tennessee:
4.0% (73,770)
Number of families with income $20k - 30k:
Oakland:
8.0% (226)
Tennessee:
5.6% (104,070)
Number of families with income $30k - 40k:
Oakland:
2.6% (72)
Tennessee:
7.2% (133,292)
Number of families with income $40k - 50k:
Oakland:
3.0% (84)
State:
7.4% (136,997)
Number of families with income $50k - 60k:
Oakland:
8.3% (233)
Tennessee:
7.1% (131,374)
Number of families with income $60k - 75k:
Oakland:
8.2% (231)
State:
10.8% (198,685)
Number of families with income $75k - 100k:
Oakland:
18.7% (524)
State:
15.1% (279,195)
Number of families with income $100k - 125k:
Oakland:
21.5% (604)
State:
11.7% (216,356)
Number of families with income $125k - 150k:
Oakland:
10.9% (307)
State:
7.8% (144,000)
Number of families with income $150k - 200k:
Oakland:
10.7% (302)
Tennessee:
9.3% (172,160)
Number of families with income > $200k:
Oakland:
6.3% (178)
Tennessee:
10.0% (183,756)
Median non-family income in Oakland in 2022:
Oakland:
$55,705
Tennessee:
$40,285
Change in median non-family income between 2000 and 2022:
Oakland, Tennessee:
+57.7%
State:
+91.5%
Median per capita income in Oakland in 2022:
Oakland:
$39,124
State:
$36,704
Change in median per capita income between 2000 and 2022:
Oakland, Tennessee:
+102.0%
State:
+89.3%
Income statistics for White residents
Median household income in Oakland, TN in 2022:
Oakland:
$96,567
State:
$69,826
Change in median household income between 2000 and 2022:
Oakland, Tennessee:
+84.7%
Tennessee:
+82.9%
Number of households with income < $10k:
Oakland:
0.9% (24)
Tennessee:
4.6% (100,279)
Number of households with income $10k - 20k:
Oakland:
0.9% (26)
State:
7.6% (165,031)
Number of households with income $20k - 30k:
Oakland:
7.4% (205)
Tennessee:
7.4% (160,229)
Number of households with income $30k - 40k:
Oakland:
3.5% (98)
State:
8.1% (174,784)
Number of households with income $40k - 50k:
Oakland:
4.9% (137)
Tennessee:
7.8% (169,622)
Number of households with income $50k - 60k:
Oakland:
10.2% (285)
State:
7.6% (165,508)
Number of households with income $60k - 75k:
Oakland:
6.5% (181)
Tennessee:
10.3% (223,937)
Number of households with income $75k - 100k:
Oakland:
16.2% (451)
Tennessee:
13.5% (292,688)
Number of households with income $100k - 125k:
Oakland:
22.5% (626)
Tennessee:
10.1% (219,251)
Number of households with income $125k - 150k:
Oakland:
10.7% (297)
State:
6.6% (142,574)
Number of households with income $150k - 200k:
Oakland:
8.0% (223)
State:
7.7% (166,039)
Number of households with income > $200k:
Oakland:
8.4% (233)
State:
8.5% (184,546)
Aggregate household income in Oakland in 2022: $297,593,143
Median family income in Oakland in 2022:
Oakland:
$106,709
Tennessee:
$86,015
Number of families with income < $10k:
Oakland:
1.2% (26)
State:
3.1% (43,751)
Number of families with income $20k - 30k:
Oakland:
7.0% (157)
State:
5.0% (70,431)
Number of families with income $30k - 40k:
Oakland:
3.1% (69)
Tennessee:
6.6% (93,498)
Number of families with income $40k - 50k:
Oakland:
2.6% (59)
Tennessee:
6.8% (96,726)
Number of families with income $50k - 60k:
Oakland:
7.7% (173)
State:
7.2% (101,879)
Number of families with income $60k - 75k:
Oakland:
6.1% (138)
Tennessee:
10.7% (151,997)
Number of families with income $75k - 100k:
Oakland:
18.4% (411)
State:
15.4% (218,373)
Number of families with income $100k - 125k:
Oakland:
25.3% (567)
State:
12.6% (178,761)
Number of families with income $125k - 150k:
Oakland:
11.4% (256)
Tennessee:
8.2% (116,575)
Number of families with income $150k - 200k:
Oakland:
9.5% (212)
State:
9.9% (141,123)
Number of families with income > $200k:
Oakland:
7.7% (173)
State:
11.2% (159,431)
Median non-family income in Oakland in 2022:
Oakland:
$59,764
State:
$41,178
Change in median non-family income between 2000 and 2022:
Oakland, Tennessee:
+59.4%
Tennessee:
+91.1%
Median per capita income in Oakland in 2022:
Oakland:
$42,788
Tennessee:
$40,126
Change in median per capita income between 2000 and 2022:
Oakland, Tennessee:
+111.7%
Tennessee:
+92.6%
Income statistics for Black or African American residents
Median household income in Oakland, TN in 2022:
Oakland:
$67,327
Tennessee:
$49,531
Change in median household income between 2000 and 2022:
Oakland, Tennessee:
+43.0%
State:
+82.3%
Number of households with income < $10k:
Oakland:
0.0% (0)
State:
9.1% (39,909)
Number of households with income $10k - 20k:
Oakland:
12.1% (90)
Tennessee:
10.5% (46,276)
Number of households with income $20k - 30k:
Oakland:
8.5% (63)
Tennessee:
10.2% (45,072)
Number of households with income $30k - 40k:
Oakland:
7.9% (59)
State:
10.0% (43,885)
Number of households with income $40k - 50k:
Oakland:
3.6% (27)
State:
10.7% (47,267)
Number of households with income $50k - 60k:
Oakland:
10.9% (81)
State:
7.7% (33,868)
Number of households with income $60k - 75k:
Oakland:
19.7% (147)
State:
10.5% (46,247)
Number of households with income $75k - 100k:
Oakland:
11.8% (88)
State:
12.6% (55,465)
Number of households with income $100k - 125k:
Oakland:
6.7% (50)
Tennessee:
6.7% (29,515)
Number of households with income $125k - 150k:
Oakland:
6.8% (51)
Tennessee:
4.8% (21,306)
Number of households with income $150k - 200k:
Oakland:
11.4% (85)
Tennessee:
4.6% (20,425)
Number of households with income > $200k:
Oakland:
0.5% (4)
State:
2.5% (11,183)
Aggregate household income in Oakland in 2022: $52,308,998
Median family income in Oakland in 2022:
Oakland:
$79,763
State:
$61,153
Number of families with income $10k - 20k:
Oakland:
1.9% (10)
State:
6.0% (15,530)
Number of families with income $20k - 30k:
Oakland:
11.7% (58)
State:
8.6% (22,263)
Number of families with income $40k - 50k:
Oakland:
5.3% (26)
State:
10.2% (26,463)
Number of families with income $50k - 60k:
Oakland:
10.2% (50)
State:
6.9% (17,798)
Number of families with income $60k - 75k:
Oakland:
17.1% (85)
Tennessee:
11.6% (30,015)
Number of families with income $75k - 100k:
Oakland:
21.0% (104)
State:
14.7% (38,065)
Number of families with income $100k - 125k:
Oakland:
5.6% (28)
Tennessee:
8.8% (22,648)
Number of families with income $125k - 150k:
Oakland:
9.4% (46)
State:
6.1% (15,758)
Number of families with income $150k - 200k:
Oakland:
17.0% (84)
State:
6.4% (16,520)
Number of families with income > $200k:
Oakland:
0.8% (4)
Tennessee:
3.4% (8,711)
Median non-family income in Oakland in 2022:
Oakland:
$36,420
Tennessee:
$35,793
Median per capita income in Oakland in 2022:
Oakland:
$29,181
State:
$27,306
Change in median per capita income between 2000 and 2022:
Oakland, Tennessee:
+86.9%
State:
+105.3%
Income statistics for Asian residents
Aggregate household income in Oakland in 2022: $1,925,591
Median per capita income in Oakland in 2022:
Oakland:
$46,049
Tennessee:
$46,931
Change in median per capita income between 2000 and 2022:
Oakland, Tennessee:
+71.7%
State:
+130.8%
Income statistics for Hispanic or Latino residents
Number of households with income < $10k:
Oakland:
0.0% (0)
Tennessee:
7.2% (8,567)
Number of households with income $10k - 20k:
Oakland:
0.0% (0)
State:
6.4% (7,670)
Number of households with income $20k - 30k:
Oakland:
0.0% (0)
State:
9.4% (11,247)
Number of households with income $30k - 40k:
Oakland:
33.7% (32)
State:
10.1% (12,072)
Number of households with income $40k - 50k:
Oakland:
0.0% (0)
State:
10.0% (11,947)
Number of households with income $50k - 60k:
Oakland:
0.0% (0)
Tennessee:
8.0% (9,569)
Number of households with income $60k - 75k:
Oakland:
11.6% (11)
Tennessee:
10.3% (12,315)
Number of households with income $75k - 100k:
Oakland:
0.0% (0)
State:
15.3% (18,285)
Number of households with income $100k - 125k:
Oakland:
0.0% (0)
Tennessee:
8.3% (9,886)
Number of households with income $125k - 150k:
Oakland:
33.7% (32)
State:
5.9% (7,066)
Number of households with income $150k - 200k:
Oakland:
0.0% (0)
State:
4.9% (5,822)
Number of households with income > $200k:
Oakland:
21.1% (20)
State:
4.5% (5,337)
Aggregate household income in Oakland in 2022: $10,177,289
Median family income in Oakland in 2022:
Oakland:
$228,083
Tennessee:
$64,014
Number of families with income $60k - 75k:
Oakland:
35.5% (11)
State:
10.8% (9,605)
Number of families with income > $200k:
Oakland:
64.5% (20)
Tennessee:
5.1% (4,577)
Median per capita income in Oakland in 2022:
Oakland:
$82,932
State:
$21,276
Income statistics for American Indian and Alaska Native residents
Median per capita income in Oakland in 2022:
Oakland:
$6,666
Tennessee:
$25,981
Change in median per capita income between 2000 and 2022:
Oakland, Tennessee:
+41.0%
Tennessee:
+40.2%
Income statistics for Multirace residents
Number of households with income < $10k:
Oakland:
0.0% (0)
State:
6.7% (9,867)
Number of households with income $10k - 20k:
Oakland:
0.0% (0)
State:
8.6% (12,639)
Number of households with income $20k - 30k:
Oakland:
0.0% (0)
State:
9.2% (13,555)
Number of households with income $30k - 40k:
Oakland:
0.0% (0)
State:
10.3% (15,117)
Number of households with income $40k - 50k:
Oakland:
0.0% (0)
State:
9.4% (13,829)
Number of households with income $50k - 60k:
Oakland:
0.0% (0)
Tennessee:
7.5% (10,969)
Number of households with income $60k - 75k:
Oakland:
50.0% (7)
State:
9.2% (13,568)
Number of households with income $75k - 100k:
Oakland:
0.0% (0)
Tennessee:
12.6% (18,516)
Number of households with income $100k - 125k:
Oakland:
0.0% (0)
Tennessee:
8.6% (12,656)
Number of households with income $125k - 150k:
Oakland:
0.0% (0)
State:
5.9% (8,674)
Number of households with income $150k - 200k:
Oakland:
50.0% (7)
State:
7.2% (10,611)
Number of households with income > $200k:
Oakland:
0.0% (0)
Tennessee:
4.8% (6,986)
Aggregate household income in Oakland in 2022: $1,479,395
Median per capita income in Oakland in 2022:
Oakland:
$11,686
State:
$24,436
Change in median per capita income between 2000 and 2022:: -30.0%
Oakland, Tennessee:
-30.0%
Tennessee:
+84.3%
Income statistics for other residents
Number of households with income < $10k:
Oakland:
0.0% (0)
State:
6.8% (2,986)
Number of households with income $10k - 20k:
Oakland:
0.0% (0)
Tennessee:
6.3% (2,777)
Number of households with income $20k - 30k:
Oakland:
0.0% (0)
State:
9.2% (4,034)
Number of households with income $30k - 40k:
Oakland:
0.0% (0)
Tennessee:
13.2% (5,819)
Number of households with income $40k - 50k:
Oakland:
0.0% (0)
Tennessee:
11.9% (5,244)
Number of households with income $50k - 60k:
Oakland:
0.0% (0)
State:
7.3% (3,232)
Number of households with income $60k - 75k:
Oakland:
0.0% (0)
State:
12.2% (5,384)
Number of households with income $75k - 100k:
Oakland:
0.0% (0)
State:
13.1% (5,771)
Number of households with income $100k - 125k:
Oakland:
0.0% (0)
State:
7.8% (3,429)
Number of households with income $125k - 150k:
Oakland:
100.0% (30)
Tennessee:
4.3% (1,881)
Number of households with income $150k - 200k:
Oakland:
0.0% (0)
State:
3.4% (1,486)
Number of households with income > $200k:
Oakland:
0.0% (0)
State:
4.6% (2,040)
Aggregate household income in Oakland in 2022: $1,537,695
Median per capita income in Oakland in 2022:
Oakland:
$58,124
Tennessee:
$21,430
Change in median per capita income between 2000 and 2022:
Oakland, Tennessee:
+109.7%
State:
+105.6%
Discuss Oakland, Tennessee (TN) on our hugely popular Tennessee forum.