North Norwich, New York (NY) income map, earnings map, and wages data
The median household income in North Norwich, NY in 2022 was $68,176, which was 16.7% less than the median annual income of $79,557 across the entire state of New York. Compared to the median income of $37,450 in 2000 this represents an increase of 45.1%. The per capita income in 2022 was $34,686, which means an increase of 50.9% compared to 2000 when it was $17,022.
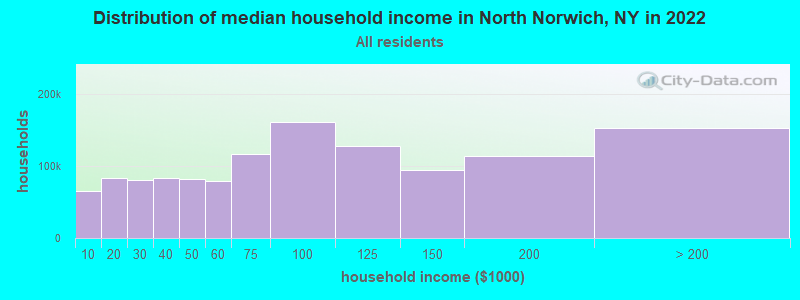
Income statistics for all residents
Median household income in North Norwich, NY in 2022:| North Norwich: | $68,177 |
| State: | $79,557 |
Change in median household income between 2000 and 2022:| North Norwich, New York: | +82.0% |
| State: | +83.3% |
Number of households with income < $10k:| North Norwich: | 6.8% (227,785) |
| State: | 6.8% (527,598) |
Number of households with income $10k - 20k:| North Norwich: | 7.4% (248,181) |
| State: | 7.4% (574,940) |
Number of households with income $20k - 30k:| North Norwich: | 6.7% (223,463) |
| State: | 6.7% (517,718) |
Number of households with income $30k - 40k:| North Norwich: | 6.5% (218,679) |
| State: | 6.5% (506,674) |
Number of households with income $40k - 50k:| North Norwich: | 6.1% (203,026) |
| State: | 6.1% (470,439) |
Number of households with income $50k - 60k:| North Norwich: | 5.8% (195,947) |
| State: | 5.8% (454,042) |
Number of households with income $60k - 75k:| North Norwich: | 8.5% (283,749) |
| State: | 8.5% (657,508) |
Number of households with income $75k - 100k:| North Norwich: | 11.6% (388,318) |
| State: | 11.6% (899,824) |
Number of households with income $100k - 125k:| North Norwich: | 9.3% (312,372) |
| New York: | 9.3% (723,825) |
Number of households with income $125k - 150k:| North Norwich: | 7.1% (238,412) |
| State: | 7.1% (552,420) |
Number of households with income $150k - 200k:| North Norwich: | 9.4% (313,815) |
| New York: | 9.4% (727,051) |
Number of households with income > $200k:| North Norwich: | 15.0% (501,769) |
| State: | 15.0% (1,162,269) |
Aggregate household income in North Norwich in 2022: $7,400,647,938
Median family income in North Norwich in 2022:| North Norwich: | $80,969 |
| State: | $99,066 |
Median non-family income in North Norwich in 2022:| North Norwich: | $39,337 |
| State: | $50,181 |
Change in median non-family income between 2000 and 2022:| North Norwich, New York: | +81.3% |
| State: | +85.4% |
Median per capita income in North Norwich in 2022:| North Norwich: | $34,687 |
| State: | $47,421 |
Change in median per capita income between 2000 and 2022:| North Norwich, New York: | +103.8% |
| State: | +102.7% |
Income statistics for White residents
Median household income in North Norwich, NY in 2022:| North Norwich: | $67,831 |
| State: | $89,408 |
Change in median household income between 2000 and 2022:| North Norwich, New York: | +83.3% |
| State: | +85.5% |
Number of households with income < $10k:| North Norwich: | 4.8% (86,196) |
| State: | 4.8% (225,550) |
Number of households with income $10k - 20k:| North Norwich: | 6.1% (111,057) |
| State: | 6.1% (289,425) |
Number of households with income $20k - 30k:| North Norwich: | 6.0% (107,722) |
| State: | 5.9% (280,254) |
Number of households with income $30k - 40k:| North Norwich: | 6.1% (110,924) |
| State: | 6.1% (288,263) |
Number of households with income $40k - 50k:| North Norwich: | 5.9% (107,114) |
| State: | 5.9% (278,079) |
Number of households with income $50k - 60k:| North Norwich: | 5.7% (103,119) |
| New York: | 5.7% (267,554) |
Number of households with income $60k - 75k:| North Norwich: | 8.5% (153,563) |
| State: | 8.4% (398,344) |
Number of households with income $75k - 100k:| North Norwich: | 11.8% (213,851) |
| New York: | 11.8% (554,841) |
Number of households with income $100k - 125k:| North Norwich: | 10.0% (180,557) |
| State: | 10.0% (469,794) |
Number of households with income $125k - 150k:| North Norwich: | 7.7% (138,466) |
| State: | 7.6% (360,467) |
Number of households with income $150k - 200k:| North Norwich: | 10.1% (182,392) |
| New York: | 10.1% (477,078) |
Number of households with income > $200k:| North Norwich: | 17.4% (314,615) |
| State: | 17.6% (829,233) |
Aggregate household income in North Norwich in 2022: $4,890,754,369
Median family income in North Norwich in 2022:| North Norwich: | $82,555 |
| State: | $115,170 |
Number of families with income < $10k:| North Norwich: | 5.6% (22) |
| State: | 2.5% (68,851) |
Number of families with income $10k - 20k:| North Norwich: | 6.2% (24) |
| State: | 3.0% (83,127) |
Number of families with income $20k - 30k:| North Norwich: | 5.4% (21) |
| State: | 3.5% (97,578) |
Number of families with income $30k - 40k:| North Norwich: | 6.0% (24) |
| New York: | 4.1% (114,108) |
Number of families with income $40k - 50k:| North Norwich: | 7.2% (28) |
| New York: | 4.7% (130,902) |
Number of families with income $50k - 60k:| North Norwich: | 7.4% (29) |
| State: | 4.9% (135,118) |
Number of families with income $60k - 75k:| North Norwich: | 8.7% (34) |
| New York: | 7.8% (216,254) |
Number of families with income $75k - 100k:| North Norwich: | 12.1% (47) |
| New York: | 12.4% (342,382) |
Number of families with income $100k - 125k:| North Norwich: | 7.3% (29) |
| State: | 11.4% (314,917) |
Number of families with income $125k - 150k:| North Norwich: | 9.1% (36) |
| State: | 9.4% (260,489) |
Number of families with income $150k - 200k:| North Norwich: | 11.0% (43) |
| New York: | 13.2% (365,586) |
Number of families with income > $200k:| North Norwich: | 14.0% (55) |
| State: | 23.2% (642,319) |
Median non-family income in North Norwich in 2022:| North Norwich: | $39,410 |
| State: | $54,783 |
Change in median non-family income between 2000 and 2022:| North Norwich, New York: | +83.9% |
| State: | +87.9% |
Median per capita income in North Norwich in 2022:| North Norwich: | $35,797 |
| State: | $57,640 |
Change in median per capita income between 2000 and 2022:| North Norwich, New York: | +111.0% |
| State: | +111.6% |
Income statistics for Black or African American residents
Median household income in North Norwich, NY in 2022:| North Norwich: | $83,829 |
| New York: | $57,898 |
Change in median household income between 2000 and 2022:| North Norwich, New York: | +100.2% |
| State: | +84.6% |
Number of households with income < $10k:| North Norwich: | 12.0% (85,850) |
| State: | 12.0% (128,500) |
Number of households with income $10k - 20k:| North Norwich: | 10.0% (71,775) |
| State: | 10.0% (107,541) |
Number of households with income $20k - 30k:| North Norwich: | 8.4% (60,239) |
| State: | 8.4% (90,192) |
Number of households with income $30k - 40k:| North Norwich: | 7.4% (53,092) |
| State: | 7.4% (79,579) |
Number of households with income $40k - 50k:| North Norwich: | 6.8% (48,410) |
| State: | 6.8% (72,491) |
Number of households with income $50k - 60k:| North Norwich: | 6.6% (47,479) |
| State: | 6.7% (71,309) |
Number of households with income $60k - 75k:| North Norwich: | 8.9% (63,475) |
| State: | 8.9% (95,050) |
Number of households with income $75k - 100k:| North Norwich: | 11.5% (82,357) |
| State: | 11.5% (123,569) |
Number of households with income $100k - 125k:| North Norwich: | 8.1% (57,655) |
| State: | 8.1% (86,632) |
Number of households with income $125k - 150k:| North Norwich: | 6.1% (43,256) |
| New York: | 6.0% (64,788) |
Number of households with income $150k - 200k:| North Norwich: | 7.1% (51,041) |
| State: | 7.2% (76,644) |
Number of households with income > $200k:| North Norwich: | 7.0% (49,844) |
| New York: | 7.0% (75,062) |
Aggregate household income in North Norwich in 2022: $5,994,407
Median family income in North Norwich in 2022:| North Norwich: | $81,737 |
| State: | $72,528 |
Median non-family income in North Norwich in 2022:| North Norwich: | $89,527 |
| State: | $37,265 |
Change in median non-family income between 2000 and 2022:| North Norwich, New York: | +104.6% |
| State: | +81.7% |
Median per capita income in North Norwich in 2022:| North Norwich: | $42,437 |
| State: | $31,947 |
Change in median per capita income between 2000 and 2022:| North Norwich, New York: | +99.4% |
| New York: | +106.1% |
Income statistics for Asian residents
Median household income in North Norwich, NY in 2022:| North Norwich: | $181,296 |
| State: | $89,947 |
Change in median household income between 2000 and 2022:| North Norwich, New York: | +77.3% |
| State: | +98.1% |
Number of households with income < $10k:| North Norwich: | 6.9% (47,900) |
| State: | 6.9% (42,537) |
Number of households with income $10k - 20k:| North Norwich: | 7.3% (50,399) |
| New York: | 7.3% (44,745) |
Number of households with income $20k - 30k:| North Norwich: | 6.2% (43,154) |
| State: | 6.2% (38,249) |
Number of households with income $30k - 40k:| North Norwich: | 5.5% (38,281) |
| New York: | 5.5% (33,993) |
Number of households with income $40k - 50k:| North Norwich: | 4.9% (33,601) |
| State: | 4.8% (29,795) |
Number of households with income $50k - 60k:| North Norwich: | 5.2% (35,938) |
| State: | 5.2% (32,100) |
Number of households with income $60k - 75k:| North Norwich: | 7.3% (50,214) |
| State: | 7.3% (44,615) |
Number of households with income $75k - 100k:| North Norwich: | 10.9% (75,082) |
| State: | 10.8% (66,687) |
Number of households with income $100k - 125k:| North Norwich: | 8.2% (56,412) |
| State: | 8.2% (50,233) |
Number of households with income $125k - 150k:| North Norwich: | 7.2% (49,846) |
| New York: | 7.2% (44,299) |
Number of households with income $150k - 200k:| North Norwich: | 10.4% (71,715) |
| State: | 10.4% (63,837) |
Number of households with income > $200k:| North Norwich: | 20.1% (139,173) |
| New York: | 20.1% (123,891) |
Aggregate household income in North Norwich in 2022: $4,511,014
Median family income in North Norwich in 2022:| North Norwich: | $155,681 |
| State: | $98,136 |
Median per capita income in North Norwich in 2022:| North Norwich: | $36,053 |
| State: | $46,726 |
Change in median per capita income between 2000 and 2022:| North Norwich, New York: | +126.5% |
| State: | +126.6% |
Income statistics for Hispanic or Latino residents
Median household income in North Norwich, NY in 2022:| North Norwich: | $120,391 |
| New York: | $60,468 |
Change in median household income between 2000 and 2022:| North Norwich, New York: | +96.6% |
| State: | +98.3% |
Number of households with income < $10k:| North Norwich: | 10.0% (127,627) |
| State: | 9.9% (127,185) |
Number of households with income $10k - 20k:| North Norwich: | 10.7% (137,386) |
| New York: | 10.7% (136,699) |
Number of households with income $20k - 30k:| North Norwich: | 8.1% (103,452) |
| State: | 8.1% (102,991) |
Number of households with income $30k - 40k:| North Norwich: | 7.8% (100,205) |
| State: | 7.8% (100,149) |
Number of households with income $40k - 50k:| North Norwich: | 6.8% (87,671) |
| State: | 6.9% (87,760) |
Number of households with income $50k - 60k:| North Norwich: | 6.3% (81,185) |
| State: | 6.3% (80,968) |
Number of households with income $60k - 75k:| North Norwich: | 8.6% (110,656) |
| State: | 8.7% (110,631) |
Number of households with income $75k - 100k:| North Norwich: | 11.2% (142,834) |
| State: | 11.2% (142,787) |
Number of households with income $100k - 125k:| North Norwich: | 8.2% (104,666) |
| New York: | 8.2% (104,850) |
Number of households with income $125k - 150k:| North Norwich: | 6.3% (80,306) |
| New York: | 6.3% (80,274) |
Number of households with income $150k - 200k:| North Norwich: | 7.4% (94,935) |
| State: | 7.4% (95,117) |
Number of households with income > $200k:| North Norwich: | 8.6% (109,487) |
| State: | 8.6% (109,514) |
Aggregate household income in North Norwich in 2022: $8,339,689
Median family income in North Norwich in 2022:| North Norwich: | $129,888 |
| New York: | $68,770 |
Number of families with income < $10k:| North Norwich: | 13.3% (13) |
| State: | 6.9% (58,565) |
Number of families with income $10k - 20k:| North Norwich: | 12.6% (12) |
| New York: | 7.0% (59,058) |
Number of families with income $20k - 30k:| North Norwich: | 11.7% (11) |
| State: | 8.0% (68,048) |
Number of families with income $30k - 40k:| North Norwich: | 11.3% (11) |
| New York: | 8.4% (70,668) |
Number of families with income $40k - 50k:| North Norwich: | 9.8% (9) |
| State: | 7.4% (62,941) |
Number of families with income $50k - 60k:| North Norwich: | 8.4% (8) |
| State: | 6.6% (55,592) |
Number of families with income $60k - 75k:| North Norwich: | 8.0% (8) |
| New York: | 9.3% (78,564) |
Number of families with income $75k - 100k:| North Norwich: | 8.4% (8) |
| State: | 12.6% (106,685) |
Number of families with income $100k - 125k:| North Norwich: | 3.8% (4) |
| New York: | 9.4% (79,139) |
Number of families with income $125k - 150k:| North Norwich: | 3.9% (4) |
| State: | 6.9% (58,255) |
Number of families with income $150k - 200k:| North Norwich: | 4.5% (4) |
| State: | 8.3% (69,877) |
Number of families with income > $200k:| North Norwich: | 4.2% (4) |
| New York: | 9.3% (78,555) |
Median per capita income in North Norwich in 2022:| North Norwich: | $47,079 |
| State: | $29,761 |
Change in median per capita income between 2000 and 2022:| North Norwich, New York: | +127.3% |
| State: | +132.7% |
Income statistics for American Indian and Alaska Native residents
Number of households with income < $10k:| North Norwich: | 8.6% (2,959) |
| State: | 8.6% (3,559) |
Number of households with income $10k - 20k:| North Norwich: | 6.0% (2,049) |
| State: | 5.9% (2,455) |
Number of households with income $20k - 30k:| North Norwich: | 8.2% (2,815) |
| New York: | 8.2% (3,393) |
Number of households with income $30k - 40k:| North Norwich: | 11.9% (4,090) |
| New York: | 11.9% (4,918) |
Number of households with income $40k - 50k:| North Norwich: | 6.4% (2,212) |
| New York: | 6.5% (2,682) |
Number of households with income $50k - 60k:| North Norwich: | 6.0% (2,079) |
| State: | 6.1% (2,516) |
Number of households with income $60k - 75k:| North Norwich: | 9.9% (3,413) |
| New York: | 10.0% (4,125) |
Number of households with income $75k - 100k:| North Norwich: | 13.4% (4,593) |
| New York: | 13.3% (5,517) |
Number of households with income $100k - 125k:| North Norwich: | 8.4% (2,874) |
| State: | 8.4% (3,463) |
Number of households with income $125k - 150k:| North Norwich: | 7.0% (2,407) |
| New York: | 7.0% (2,887) |
Number of households with income $150k - 200k:| North Norwich: | 10.0% (3,428) |
| New York: | 9.9% (4,106) |
Number of households with income > $200k:| North Norwich: | 4.2% (1,452) |
| State: | 4.2% (1,744) |
Median per capita income in North Norwich in 2022:| North Norwich: | $37,459 |
| State: | $25,837 |
Change in median per capita income between 2000 and 2022:| North Norwich, New York: | +75.0% |
| State: | +99.6% |
Income statistics for Multirace residents
Median household income in North Norwich, NY in 2022:| North Norwich: | $185,123 |
| State: | $73,557 |
Change in median household income between 2000 and 2022:| North Norwich, New York: | +116.5% |
| State: | +123.9% |
Number of households with income < $10k:| North Norwich: | 8.9% (75,460) |
| New York: | 8.9% (57,924) |
Number of households with income $10k - 20k:| North Norwich: | 8.7% (73,594) |
| New York: | 8.7% (56,590) |
Number of households with income $20k - 30k:| North Norwich: | 7.1% (60,155) |
| State: | 7.1% (46,287) |
Number of households with income $30k - 40k:| North Norwich: | 6.9% (58,594) |
| State: | 6.9% (45,132) |
Number of households with income $40k - 50k:| North Norwich: | 5.8% (49,169) |
| State: | 5.8% (37,946) |
Number of households with income $50k - 60k:| North Norwich: | 5.6% (47,241) |
| State: | 5.6% (36,410) |
Number of households with income $60k - 75k:| North Norwich: | 7.8% (65,897) |
| State: | 7.8% (50,819) |
Number of households with income $75k - 100k:| North Norwich: | 11.7% (98,746) |
| State: | 11.7% (76,024) |
Number of households with income $100k - 125k:| North Norwich: | 9.3% (78,578) |
| State: | 9.3% (60,635) |
Number of households with income $125k - 150k:| North Norwich: | 6.2% (52,652) |
| State: | 6.2% (40,533) |
Number of households with income $150k - 200k:| North Norwich: | 8.6% (73,241) |
| State: | 8.6% (56,409) |
Number of households with income > $200k:| North Norwich: | 13.4% (113,706) |
| State: | 13.4% (87,442) |
Aggregate household income in North Norwich in 2022: $3,877,780
Median non-family income in North Norwich in 2022:| North Norwich: | $183,416 |
| State: | $46,403 |
Change in median non-family income between 2000 and 2022:| North Norwich, New York: | +114.5% |
| New York: | +113.6% |
Median per capita income in North Norwich in 2022:| North Norwich: | $66,025 |
| New York: | $36,931 |
Income statistics for other residents
Number of households with income < $10k:| North Norwich: | 10.0% (3) |
| State: | 10.3% (69,252) |
Number of households with income $10k - 20k:| North Norwich: | 10.0% (3) |
| New York: | 11.0% (73,890) |
Number of households with income $20k - 30k:| North Norwich: | 6.7% (2) |
| New York: | 8.8% (59,096) |
Number of households with income $30k - 40k:| North Norwich: | 6.7% (2) |
| State: | 8.1% (54,418) |
Number of households with income $40k - 50k:| North Norwich: | 6.7% (2) |
| State: | 7.3% (49,042) |
Number of households with income $50k - 60k:| North Norwich: | 6.7% (2) |
| New York: | 6.5% (43,945) |
Number of households with income $60k - 75k:| North Norwich: | 10.0% (3) |
| State: | 9.5% (64,087) |
Number of households with income $75k - 100k:| North Norwich: | 10.0% (3) |
| State: | 10.9% (73,094) |
Number of households with income $100k - 125k:| North Norwich: | 10.0% (3) |
| New York: | 7.9% (53,055) |
Number of households with income $125k - 150k:| North Norwich: | 6.7% (2) |
| State: | 5.9% (39,446) |
Number of households with income $150k - 200k:| North Norwich: | 10.0% (3) |
| State: | 7.2% (48,653) |
Number of households with income > $200k:| North Norwich: | 6.7% (2) |
| State: | 6.6% (44,703) |
Aggregate household income in North Norwich in 2022: $2,597,251
Median family income in North Norwich in 2022:| North Norwich: | $174,086 |
| New York: | $63,465 |
Median per capita income in North Norwich in 2022:| North Norwich: | $42,178 |
| State: | $26,975 |
Change in median per capita income between 2000 and 2022:| North Norwich, New York: | +132.7% |
| State: | +144.6% |