New Albion, New York (NY) income map, earnings map, and wages data
The median household income in New Albion, NY in 2022 was $49,771, which was 59.8% less than the median annual income of $79,557 across the entire state of New York. Compared to the median income of $32,917 in 2000 this represents an increase of 33.9%. The per capita income in 2022 was $29,709, which means an increase of 46.7% compared to 2000 when it was $15,841.
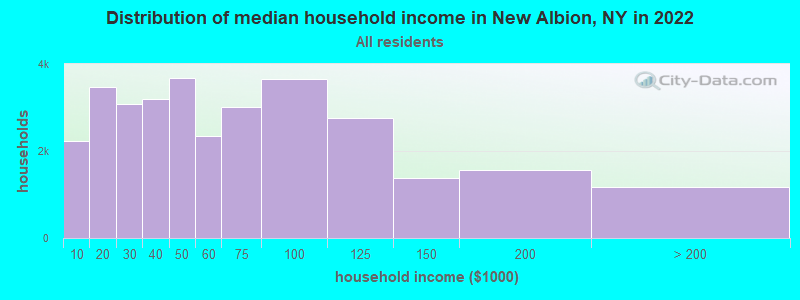
Income statistics for all residents
Median household income in New Albion, NY in 2022:| New Albion: | $49,772 |
| State: | $79,557 |
Change in median household income between 2000 and 2022:| New Albion, New York: | +51.2% |
| State: | +83.3% |
Number of households with income < $10k:| New Albion: | 7.1% (2,226) |
| New York: | 6.8% (527,598) |
Number of households with income $10k - 20k:| New Albion: | 11.0% (3,469) |
| State: | 7.4% (574,940) |
Number of households with income $20k - 30k:| New Albion: | 9.8% (3,077) |
| New York: | 6.7% (517,718) |
Number of households with income $30k - 40k:| New Albion: | 10.1% (3,190) |
| State: | 6.5% (506,674) |
Number of households with income $40k - 50k:| New Albion: | 11.7% (3,685) |
| State: | 6.1% (470,439) |
Number of households with income $50k - 60k:| New Albion: | 7.4% (2,346) |
| State: | 5.8% (454,042) |
Number of households with income $60k - 75k:| New Albion: | 9.6% (3,013) |
| State: | 8.5% (657,508) |
Number of households with income $75k - 100k:| New Albion: | 11.6% (3,660) |
| New York: | 11.6% (899,824) |
Number of households with income $100k - 125k:| New Albion: | 8.7% (2,756) |
| State: | 9.3% (723,825) |
Number of households with income $125k - 150k:| New Albion: | 4.4% (1,382) |
| New York: | 7.1% (552,420) |
Number of households with income $150k - 200k:| New Albion: | 5.0% (1,572) |
| State: | 9.4% (727,051) |
Number of households with income > $200k:| New Albion: | 3.7% (1,173) |
| State: | 15.0% (1,162,269) |
Aggregate household income in New Albion in 2022: $55,125,431
Median family income in New Albion in 2022:| New Albion: | $68,108 |
| State: | $99,066 |
Median non-family income in New Albion in 2022:| New Albion: | $35,519 |
| State: | $50,181 |
Change in median non-family income between 2000 and 2022:| New Albion, New York: | +69.9% |
| State: | +85.4% |
Median per capita income in New Albion in 2022:| New Albion: | $29,710 |
| State: | $47,421 |
Change in median per capita income between 2000 and 2022:| New Albion, New York: | +87.5% |
| State: | +102.7% |
Income statistics for White residents
Median household income in New Albion, NY in 2022:| New Albion: | $49,277 |
| New York: | $89,408 |
Change in median household income between 2000 and 2022:| New Albion, New York: | +50.1% |
| New York: | +85.5% |
Number of households with income < $10k:| New Albion: | 6.4% (1,778) |
| New York: | 4.8% (225,550) |
Number of households with income $10k - 20k:| New Albion: | 11.6% (3,210) |
| State: | 6.1% (289,425) |
Number of households with income $20k - 30k:| New Albion: | 9.1% (2,524) |
| State: | 5.9% (280,254) |
Number of households with income $30k - 40k:| New Albion: | 10.6% (2,931) |
| New York: | 6.1% (288,263) |
Number of households with income $40k - 50k:| New Albion: | 11.7% (3,234) |
| State: | 5.9% (278,079) |
Number of households with income $50k - 60k:| New Albion: | 7.0% (1,940) |
| State: | 5.7% (267,554) |
Number of households with income $60k - 75k:| New Albion: | 10.0% (2,754) |
| New York: | 8.4% (398,344) |
Number of households with income $75k - 100k:| New Albion: | 11.6% (3,211) |
| New York: | 11.8% (554,841) |
Number of households with income $100k - 125k:| New Albion: | 8.5% (2,358) |
| New York: | 10.0% (469,794) |
Number of households with income $125k - 150k:| New Albion: | 4.8% (1,326) |
| State: | 7.6% (360,467) |
Number of households with income $150k - 200k:| New Albion: | 4.8% (1,330) |
| New York: | 10.1% (477,078) |
Number of households with income > $200k:| New Albion: | 3.7% (1,031) |
| State: | 17.6% (829,233) |
Aggregate household income in New Albion in 2022: $50,746,129
Median family income in New Albion in 2022:| New Albion: | $68,030 |
| State: | $115,170 |
Number of families with income < $10k:| New Albion: | 5.3% (22) |
| State: | 2.5% (68,851) |
Number of families with income $10k - 20k:| New Albion: | 5.9% (24) |
| New York: | 3.0% (83,127) |
Number of families with income $20k - 30k:| New Albion: | 6.6% (27) |
| New York: | 3.5% (97,578) |
Number of families with income $30k - 40k:| New Albion: | 12.0% (49) |
| State: | 4.1% (114,108) |
Number of families with income $40k - 50k:| New Albion: | 10.9% (44) |
| State: | 4.7% (130,902) |
Number of families with income $50k - 60k:| New Albion: | 7.8% (31) |
| New York: | 4.9% (135,118) |
Number of families with income $60k - 75k:| New Albion: | 10.3% (42) |
| State: | 7.8% (216,254) |
Number of families with income $75k - 100k:| New Albion: | 17.0% (69) |
| State: | 12.4% (342,382) |
Number of families with income $100k - 125k:| New Albion: | 12.6% (51) |
| State: | 11.4% (314,917) |
Number of families with income $125k - 150k:| New Albion: | 6.6% (27) |
| State: | 9.4% (260,489) |
Number of families with income $150k - 200k:| New Albion: | 2.2% (9) |
| State: | 13.2% (365,586) |
Number of families with income > $200k:| New Albion: | 2.8% (11) |
| New York: | 23.2% (642,319) |
Median non-family income in New Albion in 2022:| New Albion: | $35,202 |
| State: | $54,783 |
Change in median non-family income between 2000 and 2022:| New Albion, New York: | +68.4% |
| State: | +87.9% |
Median per capita income in New Albion in 2022:| New Albion: | $30,488 |
| State: | $57,640 |
Change in median per capita income between 2000 and 2022:| New Albion, New York: | +93.1% |
| State: | +111.6% |
Income statistics for Black or African American residents
Median household income in New Albion, NY in 2022:| New Albion: | $175,251 |
| State: | $57,898 |
Change in median household income between 2000 and 2022:| New Albion, New York: | +117.7% |
| State: | +84.6% |
Number of households with income < $10k:| New Albion: | 12.0% (165,013) |
| New York: | 12.0% (128,500) |
Number of households with income $10k - 20k:| New Albion: | 10.0% (137,961) |
| State: | 10.0% (107,541) |
Number of households with income $20k - 30k:| New Albion: | 8.4% (115,786) |
| State: | 8.4% (90,192) |
Number of households with income $30k - 40k:| New Albion: | 7.4% (102,048) |
| State: | 7.4% (79,579) |
Number of households with income $40k - 50k:| New Albion: | 6.8% (93,049) |
| New York: | 6.8% (72,491) |
Number of households with income $50k - 60k:| New Albion: | 6.6% (91,259) |
| State: | 6.7% (71,309) |
Number of households with income $60k - 75k:| New Albion: | 8.9% (122,005) |
| New York: | 8.9% (95,050) |
Number of households with income $75k - 100k:| New Albion: | 11.5% (158,299) |
| State: | 11.5% (123,569) |
Number of households with income $100k - 125k:| New Albion: | 8.1% (110,819) |
| New York: | 8.1% (86,632) |
Number of households with income $125k - 150k:| New Albion: | 6.1% (83,142) |
| State: | 6.0% (64,788) |
Number of households with income $150k - 200k:| New Albion: | 7.1% (98,105) |
| State: | 7.2% (76,644) |
Number of households with income > $200k:| New Albion: | 7.0% (95,805) |
| New York: | 7.0% (75,062) |
Aggregate household income in New Albion in 2022: $1,169,579
Median family income in New Albion in 2022:| New Albion: | $159,487 |
| State: | $72,528 |
Median per capita income in New Albion in 2022:| New Albion: | $51,516 |
| State: | $31,947 |
Change in median per capita income between 2000 and 2022:| New Albion, New York: | +65.0% |
| New York: | +106.1% |
Income statistics for Hispanic or Latino residents
Median household income in New Albion, NY in 2022:| New Albion: | $138,223 |
| State: | $60,468 |
Change in median household income between 2000 and 2022:| New Albion, New York: | +72.6% |
| New York: | +98.3% |
Number of households with income < $10k:| New Albion: | 10.0% (166,909) |
| State: | 9.9% (127,185) |
Number of households with income $10k - 20k:| New Albion: | 10.7% (179,671) |
| State: | 10.7% (136,699) |
Number of households with income $20k - 30k:| New Albion: | 8.1% (135,294) |
| State: | 8.1% (102,991) |
Number of households with income $30k - 40k:| New Albion: | 7.8% (131,047) |
| New York: | 7.8% (100,149) |
Number of households with income $40k - 50k:| New Albion: | 6.8% (114,656) |
| State: | 6.9% (87,760) |
Number of households with income $50k - 60k:| New Albion: | 6.3% (106,173) |
| State: | 6.3% (80,968) |
Number of households with income $60k - 75k:| New Albion: | 8.6% (144,715) |
| State: | 8.7% (110,631) |
Number of households with income $75k - 100k:| New Albion: | 11.2% (186,796) |
| New York: | 11.2% (142,787) |
Number of households with income $100k - 125k:| New Albion: | 8.2% (136,881) |
| State: | 8.2% (104,850) |
Number of households with income $125k - 150k:| New Albion: | 6.3% (105,024) |
| State: | 6.3% (80,274) |
Number of households with income $150k - 200k:| New Albion: | 7.4% (124,155) |
| New York: | 7.4% (95,117) |
Number of households with income > $200k:| New Albion: | 8.6% (143,186) |
| State: | 8.6% (109,514) |
Aggregate household income in New Albion in 2022: $3,212,528
Median family income in New Albion in 2022:| New Albion: | $169,865 |
| New York: | $68,770 |
Number of families with income < $10k:| New Albion: | 6.5% (6) |
| State: | 6.9% (58,565) |
Number of families with income $10k - 20k:| New Albion: | 13.9% (13) |
| State: | 7.0% (59,058) |
Number of families with income $20k - 30k:| New Albion: | 20.2% (19) |
| State: | 8.0% (68,048) |
Number of families with income $30k - 40k:| New Albion: | 17.1% (16) |
| State: | 8.4% (70,668) |
Number of families with income $40k - 50k:| New Albion: | 11.7% (11) |
| State: | 7.4% (62,941) |
Number of families with income $50k - 60k:| New Albion: | 7.5% (7) |
| New York: | 6.6% (55,592) |
Number of families with income $60k - 75k:| New Albion: | 9.8% (9) |
| State: | 9.3% (78,564) |
Number of families with income $75k - 100k:| New Albion: | 7.1% (7) |
| New York: | 12.6% (106,685) |
Number of families with income $100k - 125k:| New Albion: | 3.6% (3) |
| New York: | 9.4% (79,139) |
Number of families with income $125k - 150k:| New Albion: | 1.5% (1) |
| New York: | 6.9% (58,255) |
Number of families with income $150k - 200k:| New Albion: | 0.4% (0) |
| New York: | 8.3% (69,877) |
Number of families with income > $200k:| New Albion: | 0.8% (1) |
| State: | 9.3% (78,555) |
Median per capita income in New Albion in 2022:| New Albion: | $27,933 |
| New York: | $29,761 |
Change in median per capita income between 2000 and 2022:| New Albion, New York: | +38.4% |
| State: | +132.7% |
Income statistics for American Indian and Alaska Native residents
Median household income in New Albion, NY in 2022:| New Albion: | $30,953 |
| State: | $63,208 |
Change in median household income between 2000 and 2022:| New Albion, New York: | +90.5% |
| New York: | +110.1% |
Number of households with income < $10k:| New Albion: | 8.6% (970) |
| State: | 8.6% (3,559) |
Number of households with income $10k - 20k:| New Albion: | 6.0% (674) |
| New York: | 5.9% (2,455) |
Number of households with income $20k - 30k:| New Albion: | 8.2% (921) |
| New York: | 8.2% (3,393) |
Number of households with income $30k - 40k:| New Albion: | 11.9% (1,341) |
| State: | 11.9% (4,918) |
Number of households with income $40k - 50k:| New Albion: | 6.4% (720) |
| State: | 6.5% (2,682) |
Number of households with income $50k - 60k:| New Albion: | 6.0% (678) |
| State: | 6.1% (2,516) |
Number of households with income $60k - 75k:| New Albion: | 9.9% (1,115) |
| State: | 10.0% (4,125) |
Number of households with income $75k - 100k:| New Albion: | 13.4% (1,507) |
| State: | 13.3% (5,517) |
Number of households with income $100k - 125k:| New Albion: | 8.4% (941) |
| State: | 8.4% (3,463) |
Number of households with income $125k - 150k:| New Albion: | 7.0% (791) |
| New York: | 7.0% (2,887) |
Number of households with income $150k - 200k:| New Albion: | 10.0% (1,127) |
| New York: | 9.9% (4,106) |
Number of households with income > $200k:| New Albion: | 4.2% (476) |
| New York: | 4.2% (1,744) |
Aggregate household income in New Albion in 2022: $63,366
Median family income in New Albion in 2022:| New Albion: | $28,637 |
| State: | $69,721 |
Median per capita income in New Albion in 2022:| New Albion: | $31,180 |
| State: | $25,837 |
Change in median per capita income between 2000 and 2022:| New Albion, New York: | +80.3% |
| State: | +99.6% |