De Peyster, New York (NY) income map, earnings map, and wages data
The median household income in De Peyster, NY in 2022 was $53,031, which was 50.0% less than the median annual income of $79,557 across the entire state of New York. Compared to the median income of $28,750 in 2000 this represents an increase of 45.8%. The per capita income in 2022 was $19,595, which means an increase of 45.6% compared to 2000 when it was $10,667.
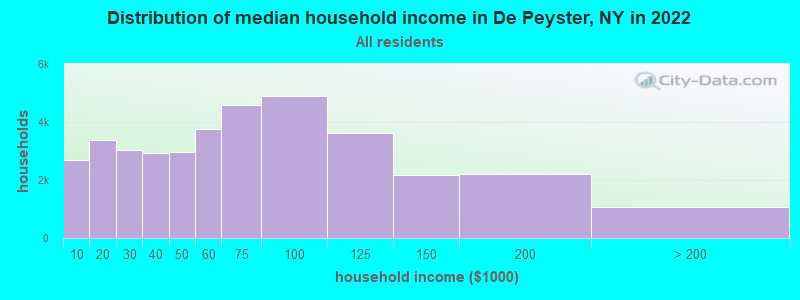
Income statistics for all residents
Median household income in De Peyster, NY in 2022:| De Peyster: | $53,031 |
| New York: | $79,557 |
Change in median household income between 2000 and 2022:| De Peyster, New York: | +84.5% |
| State: | +83.3% |
Number of households with income < $10k:| De Peyster: | 7.2% (2,679) |
| New York: | 6.8% (527,598) |
Number of households with income $10k - 20k:| De Peyster: | 9.1% (3,371) |
| State: | 7.4% (574,940) |
Number of households with income $20k - 30k:| De Peyster: | 8.1% (3,020) |
| New York: | 6.7% (517,718) |
Number of households with income $30k - 40k:| De Peyster: | 7.8% (2,922) |
| State: | 6.5% (506,674) |
Number of households with income $40k - 50k:| De Peyster: | 8.0% (2,972) |
| New York: | 6.1% (470,439) |
Number of households with income $50k - 60k:| De Peyster: | 10.1% (3,750) |
| New York: | 5.8% (454,042) |
Number of households with income $60k - 75k:| De Peyster: | 12.3% (4,585) |
| State: | 8.5% (657,508) |
Number of households with income $75k - 100k:| De Peyster: | 13.1% (4,892) |
| State: | 11.6% (899,824) |
Number of households with income $100k - 125k:| De Peyster: | 9.7% (3,611) |
| State: | 9.3% (723,825) |
Number of households with income $125k - 150k:| De Peyster: | 5.8% (2,168) |
| State: | 7.1% (552,420) |
Number of households with income $150k - 200k:| De Peyster: | 5.9% (2,201) |
| New York: | 9.4% (727,051) |
Number of households with income > $200k:| De Peyster: | 2.9% (1,065) |
| State: | 15.0% (1,162,269) |
Aggregate household income in De Peyster in 2022: $18,299,523
Median family income in De Peyster in 2022:| De Peyster: | $60,125 |
| State: | $99,066 |
Median non-family income in De Peyster in 2022:| De Peyster: | $34,233 |
| New York: | $50,181 |
Change in median non-family income between 2000 and 2022:| De Peyster, New York: | +88.9% |
| State: | +85.4% |
Median per capita income in De Peyster in 2022:| De Peyster: | $19,596 |
| New York: | $47,421 |
Change in median per capita income between 2000 and 2022:| De Peyster, New York: | +83.7% |
| New York: | +102.7% |
Income statistics for White residents
Median household income in De Peyster, NY in 2022:| De Peyster: | $53,079 |
| State: | $89,408 |
Change in median household income between 2000 and 2022:| De Peyster, New York: | +84.6% |
| State: | +85.5% |
Number of households with income < $10k:| De Peyster: | 6.9% (2,446) |
| State: | 4.8% (225,550) |
Number of households with income $10k - 20k:| De Peyster: | 9.4% (3,337) |
| State: | 6.1% (289,425) |
Number of households with income $20k - 30k:| De Peyster: | 7.9% (2,805) |
| State: | 5.9% (280,254) |
Number of households with income $30k - 40k:| De Peyster: | 8.0% (2,840) |
| State: | 6.1% (288,263) |
Number of households with income $40k - 50k:| De Peyster: | 7.9% (2,817) |
| State: | 5.9% (278,079) |
Number of households with income $50k - 60k:| De Peyster: | 9.7% (3,454) |
| New York: | 5.7% (267,554) |
Number of households with income $60k - 75k:| De Peyster: | 11.9% (4,217) |
| New York: | 8.4% (398,344) |
Number of households with income $75k - 100k:| De Peyster: | 13.3% (4,726) |
| State: | 11.8% (554,841) |
Number of households with income $100k - 125k:| De Peyster: | 10.0% (3,567) |
| State: | 10.0% (469,794) |
Number of households with income $125k - 150k:| De Peyster: | 6.0% (2,119) |
| State: | 7.6% (360,467) |
Number of households with income $150k - 200k:| De Peyster: | 5.9% (2,112) |
| State: | 10.1% (477,078) |
Number of households with income > $200k:| De Peyster: | 3.0% (1,058) |
| New York: | 17.6% (829,233) |
Aggregate household income in De Peyster in 2022: $17,911,733
Median family income in De Peyster in 2022:| De Peyster: | $60,169 |
| State: | $115,170 |
Number of families with income < $10k:| De Peyster: | 7.3% (15) |
| New York: | 2.5% (68,851) |
Number of families with income $10k - 20k:| De Peyster: | 8.4% (17) |
| New York: | 3.0% (83,127) |
Number of families with income $20k - 30k:| De Peyster: | 5.9% (12) |
| State: | 3.5% (97,578) |
Number of families with income $30k - 40k:| De Peyster: | 4.5% (9) |
| New York: | 4.1% (114,108) |
Number of families with income $40k - 50k:| De Peyster: | 9.6% (20) |
| New York: | 4.7% (130,902) |
Number of families with income $50k - 60k:| De Peyster: | 2.7% (6) |
| New York: | 4.9% (135,118) |
Number of families with income $60k - 75k:| De Peyster: | 10.2% (21) |
| State: | 7.8% (216,254) |
Number of families with income $75k - 100k:| De Peyster: | 5.4% (11) |
| State: | 12.4% (342,382) |
Number of families with income $100k - 125k:| De Peyster: | 14.0% (29) |
| State: | 11.4% (314,917) |
Number of families with income $125k - 150k:| De Peyster: | 9.6% (20) |
| New York: | 9.4% (260,489) |
Number of families with income $150k - 200k:| De Peyster: | 22.4% (47) |
| State: | 13.2% (365,586) |
Median non-family income in De Peyster in 2022:| De Peyster: | $34,140 |
| New York: | $54,783 |
Change in median non-family income between 2000 and 2022:| De Peyster, New York: | +88.4% |
| State: | +87.9% |
Median per capita income in De Peyster in 2022:| De Peyster: | $20,422 |
| State: | $57,640 |
Change in median per capita income between 2000 and 2022:| De Peyster, New York: | +89.2% |
| State: | +111.6% |
Income statistics for Black or African American residents
Aggregate household income in De Peyster in 2022: $649,918
Median per capita income in De Peyster in 2022:| De Peyster: | $3,207 |
| State: | $31,947 |
Income statistics for Hispanic or Latino residents
Median household income in De Peyster, NY in 2022:| De Peyster: | $33,592 |
| State: | $60,468 |
Change in median household income between 2000 and 2022:| De Peyster, New York: | +106.7% |
| State: | +98.3% |
Number of households with income < $10k:| De Peyster: | 10.0% (33,860) |
| State: | 9.9% (127,185) |
Number of households with income $10k - 20k:| De Peyster: | 10.7% (36,450) |
| State: | 10.7% (136,699) |
Number of households with income $20k - 30k:| De Peyster: | 8.1% (27,447) |
| State: | 8.1% (102,991) |
Number of households with income $30k - 40k:| De Peyster: | 7.8% (26,585) |
| State: | 7.8% (100,149) |
Number of households with income $40k - 50k:| De Peyster: | 6.8% (23,259) |
| State: | 6.9% (87,760) |
Number of households with income $50k - 60k:| De Peyster: | 6.3% (21,539) |
| New York: | 6.3% (80,968) |
Number of households with income $60k - 75k:| De Peyster: | 8.6% (29,358) |
| New York: | 8.7% (110,631) |
Number of households with income $75k - 100k:| De Peyster: | 11.2% (37,895) |
| State: | 11.2% (142,787) |
Number of households with income $100k - 125k:| De Peyster: | 8.2% (27,768) |
| New York: | 8.2% (104,850) |
Number of households with income $125k - 150k:| De Peyster: | 6.3% (21,306) |
| State: | 6.3% (80,274) |
Number of households with income $150k - 200k:| De Peyster: | 7.4% (25,187) |
| State: | 7.4% (95,117) |
Number of households with income > $200k:| De Peyster: | 8.6% (29,048) |
| State: | 8.6% (109,514) |
Aggregate household income in De Peyster in 2022: $62,667
Median family income in De Peyster in 2022:| De Peyster: | $27,099 |
| State: | $68,770 |
Number of families with income < $10k:| De Peyster: | 26.9% (11) |
| State: | 6.9% (58,565) |
Number of families with income $10k - 20k:| De Peyster: | 14.8% (6) |
| State: | 7.0% (59,058) |
Number of families with income $20k - 30k:| De Peyster: | 13.5% (6) |
| State: | 8.0% (68,048) |
Number of families with income $30k - 40k:| De Peyster: | 13.3% (6) |
| New York: | 8.4% (70,668) |
Number of families with income $40k - 50k:| De Peyster: | 10.4% (4) |
| State: | 7.4% (62,941) |
Number of families with income $50k - 60k:| De Peyster: | 2.5% (1) |
| New York: | 6.6% (55,592) |
Number of families with income $60k - 75k:| De Peyster: | 6.7% (3) |
| State: | 9.3% (78,564) |
Number of families with income $75k - 100k:| De Peyster: | 2.7% (1) |
| State: | 12.6% (106,685) |
Number of families with income $100k - 125k:| De Peyster: | 3.3% (1) |
| New York: | 9.4% (79,139) |
Number of families with income $125k - 150k:| De Peyster: | 2.1% (1) |
| State: | 6.9% (58,255) |
Number of families with income $150k - 200k:| De Peyster: | 3.7% (2) |
| New York: | 8.3% (69,877) |
Median per capita income in De Peyster in 2022:| De Peyster: | $6,718 |
| New York: | $29,761 |
Change in median per capita income between 2000 and 2022:| De Peyster, New York: | +12.0% |
| State: | +132.7% |
Income statistics for Multirace residents
Median household income in De Peyster, NY in 2022:| De Peyster: | $115,163 |
| State: | $73,557 |
Change in median household income between 2000 and 2022:| De Peyster, New York: | +136.2% |
| State: | +123.9% |
Number of households with income < $10k:| De Peyster: | 8.9% (43,031) |
| State: | 8.9% (57,924) |
Number of households with income $10k - 20k:| De Peyster: | 8.7% (41,966) |
| New York: | 8.7% (56,590) |
Number of households with income $20k - 30k:| De Peyster: | 7.1% (34,303) |
| New York: | 7.1% (46,287) |
Number of households with income $30k - 40k:| De Peyster: | 6.9% (33,413) |
| State: | 6.9% (45,132) |
Number of households with income $40k - 50k:| De Peyster: | 5.8% (28,039) |
| State: | 5.8% (37,946) |
Number of households with income $50k - 60k:| De Peyster: | 5.6% (26,939) |
| State: | 5.6% (36,410) |
Number of households with income $60k - 75k:| De Peyster: | 7.8% (37,578) |
| State: | 7.8% (50,819) |
Number of households with income $75k - 100k:| De Peyster: | 11.7% (56,310) |
| State: | 11.7% (76,024) |
Number of households with income $100k - 125k:| De Peyster: | 9.3% (44,809) |
| State: | 9.3% (60,635) |
Number of households with income $125k - 150k:| De Peyster: | 6.2% (30,025) |
| State: | 6.2% (40,533) |
Number of households with income $150k - 200k:| De Peyster: | 8.6% (41,766) |
| State: | 8.6% (56,409) |
Number of households with income > $200k:| De Peyster: | 13.4% (64,841) |
| State: | 13.4% (87,442) |
Aggregate household income in De Peyster in 2022: $679,427
Median family income in De Peyster in 2022:| De Peyster: | $95,890 |
| State: | $85,788 |
Median per capita income in De Peyster in 2022:| De Peyster: | $6,981 |
| State: | $36,931 |
Change in median per capita income between 2000 and 2022:| De Peyster, New York: | +52.0% |
| New York: | +158.8% |