Au Sable, New York (NY) income map, earnings map, and wages data
The median household income in Au Sable, NY in 2022 was $60,953, which was 30.5% less than the median annual income of $79,557 across the entire state of New York. Compared to the median income of $34,118 in 2000 this represents an increase of 44.0%. The per capita income in 2022 was $30,941, which means an increase of 49.0% compared to 2000 when it was $15,789.
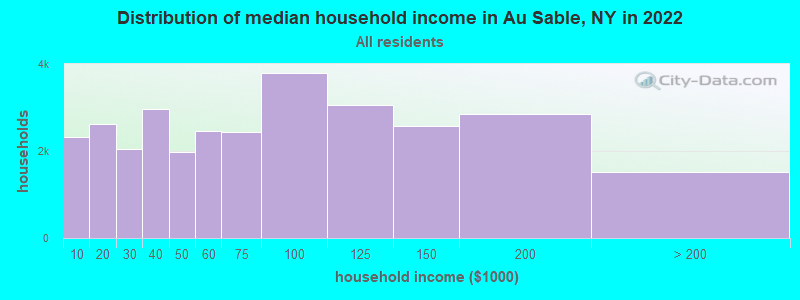
Income statistics for all residents
Median household income in Au Sable, NY in 2022:| Au Sable: | $60,953 |
| State: | $79,557 |
Change in median household income between 2000 and 2022:| Au Sable, New York: | +78.7% |
| New York: | +83.3% |
Number of households with income < $10k:| Au Sable: | 7.6% (2,315) |
| State: | 6.8% (527,598) |
Number of households with income $10k - 20k:| Au Sable: | 8.5% (2,614) |
| State: | 7.4% (574,940) |
Number of households with income $20k - 30k:| Au Sable: | 6.7% (2,051) |
| State: | 6.7% (517,718) |
Number of households with income $30k - 40k:| Au Sable: | 9.7% (2,975) |
| State: | 6.5% (506,674) |
Number of households with income $40k - 50k:| Au Sable: | 6.4% (1,967) |
| State: | 6.1% (470,439) |
Number of households with income $50k - 60k:| Au Sable: | 8.0% (2,464) |
| New York: | 5.8% (454,042) |
Number of households with income $60k - 75k:| Au Sable: | 8.0% (2,436) |
| New York: | 8.5% (657,508) |
Number of households with income $75k - 100k:| Au Sable: | 12.4% (3,794) |
| State: | 11.6% (899,824) |
Number of households with income $100k - 125k:| Au Sable: | 10.0% (3,048) |
| State: | 9.3% (723,825) |
Number of households with income $125k - 150k:| Au Sable: | 8.4% (2,567) |
| State: | 7.1% (552,420) |
Number of households with income $150k - 200k:| Au Sable: | 9.3% (2,861) |
| State: | 9.4% (727,051) |
Number of households with income > $200k:| Au Sable: | 5.0% (1,527) |
| State: | 15.0% (1,162,269) |
Aggregate household income in Au Sable in 2022: $95,345,688
Median family income in Au Sable in 2022:| Au Sable: | $79,751 |
| New York: | $99,066 |
Median non-family income in Au Sable in 2022:| Au Sable: | $30,069 |
| New York: | $50,181 |
Change in median non-family income between 2000 and 2022:| Au Sable, New York: | +78.2% |
| State: | +85.4% |
Median per capita income in Au Sable in 2022:| Au Sable: | $30,941 |
| New York: | $47,421 |
Change in median per capita income between 2000 and 2022:| Au Sable, New York: | +96.0% |
| State: | +102.7% |
Income statistics for White residents
Median household income in Au Sable, NY in 2022:| Au Sable: | $62,902 |
| State: | $89,408 |
Change in median household income between 2000 and 2022:| Au Sable, New York: | +84.8% |
| New York: | +85.5% |
Number of households with income < $10k:| Au Sable: | 7.1% (2,009) |
| New York: | 4.8% (225,550) |
Number of households with income $10k - 20k:| Au Sable: | 7.9% (2,232) |
| New York: | 6.1% (289,425) |
Number of households with income $20k - 30k:| Au Sable: | 5.6% (1,583) |
| New York: | 5.9% (280,254) |
Number of households with income $30k - 40k:| Au Sable: | 9.8% (2,753) |
| State: | 6.1% (288,263) |
Number of households with income $40k - 50k:| Au Sable: | 6.7% (1,878) |
| State: | 5.9% (278,079) |
Number of households with income $50k - 60k:| Au Sable: | 8.4% (2,357) |
| New York: | 5.7% (267,554) |
Number of households with income $60k - 75k:| Au Sable: | 8.0% (2,258) |
| State: | 8.4% (398,344) |
Number of households with income $75k - 100k:| Au Sable: | 12.6% (3,555) |
| State: | 11.8% (554,841) |
Number of households with income $100k - 125k:| Au Sable: | 10.7% (3,008) |
| State: | 10.0% (469,794) |
Number of households with income $125k - 150k:| Au Sable: | 8.8% (2,488) |
| State: | 7.6% (360,467) |
Number of households with income $150k - 200k:| Au Sable: | 9.2% (2,593) |
| New York: | 10.1% (477,078) |
Number of households with income > $200k:| Au Sable: | 5.3% (1,491) |
| New York: | 17.6% (829,233) |
Aggregate household income in Au Sable in 2022: $91,262,003
Median family income in Au Sable in 2022:| Au Sable: | $81,796 |
| State: | $115,170 |
Number of families with income < $10k:| Au Sable: | 4.6% (30) |
| New York: | 2.5% (68,851) |
Number of families with income $10k - 20k:| Au Sable: | 5.7% (36) |
| New York: | 3.0% (83,127) |
Number of families with income $20k - 30k:| Au Sable: | 2.4% (15) |
| New York: | 3.5% (97,578) |
Number of families with income $30k - 40k:| Au Sable: | 10.8% (69) |
| State: | 4.1% (114,108) |
Number of families with income $40k - 50k:| Au Sable: | 8.0% (52) |
| New York: | 4.7% (130,902) |
Number of families with income $50k - 60k:| Au Sable: | 6.4% (41) |
| State: | 4.9% (135,118) |
Number of families with income $60k - 75k:| Au Sable: | 12.4% (80) |
| New York: | 7.8% (216,254) |
Number of families with income $75k - 100k:| Au Sable: | 8.5% (55) |
| State: | 12.4% (342,382) |
Number of families with income $100k - 125k:| Au Sable: | 12.7% (82) |
| State: | 11.4% (314,917) |
Number of families with income $125k - 150k:| Au Sable: | 24.5% (158) |
| New York: | 9.4% (260,489) |
Number of families with income > $200k:| Au Sable: | 3.9% (25) |
| State: | 23.2% (642,319) |
Median non-family income in Au Sable in 2022:| Au Sable: | $31,984 |
| State: | $54,783 |
Change in median non-family income between 2000 and 2022:| Au Sable, New York: | +88.1% |
| State: | +87.9% |
Median per capita income in Au Sable in 2022:| Au Sable: | $32,460 |
| State: | $57,640 |
Change in median per capita income between 2000 and 2022:| Au Sable, New York: | +104.3% |
| State: | +111.6% |
Income statistics for Black or African American residents
Median household income in Au Sable, NY in 2022:| Au Sable: | $24,189 |
| New York: | $57,898 |
Change in median household income between 2000 and 2022:| Au Sable, New York: | +100.2% |
| State: | +84.6% |
Number of households with income < $10k:| Au Sable: | 12.0% (24,772) |
| State: | 12.0% (128,500) |
Number of households with income $10k - 20k:| Au Sable: | 10.0% (20,711) |
| State: | 10.0% (107,541) |
Number of households with income $20k - 30k:| Au Sable: | 8.4% (17,382) |
| New York: | 8.4% (90,192) |
Number of households with income $30k - 40k:| Au Sable: | 7.4% (15,319) |
| State: | 7.4% (79,579) |
Number of households with income $40k - 50k:| Au Sable: | 6.8% (13,968) |
| State: | 6.8% (72,491) |
Number of households with income $50k - 60k:| Au Sable: | 6.6% (13,700) |
| New York: | 6.7% (71,309) |
Number of households with income $60k - 75k:| Au Sable: | 8.9% (18,316) |
| State: | 8.9% (95,050) |
Number of households with income $75k - 100k:| Au Sable: | 11.5% (23,764) |
| State: | 11.5% (123,569) |
Number of households with income $100k - 125k:| Au Sable: | 8.1% (16,636) |
| New York: | 8.1% (86,632) |
Number of households with income $125k - 150k:| Au Sable: | 6.1% (12,481) |
| New York: | 6.0% (64,788) |
Number of households with income $150k - 200k:| Au Sable: | 7.1% (14,728) |
| State: | 7.2% (76,644) |
Number of households with income > $200k:| Au Sable: | 7.0% (14,382) |
| State: | 7.0% (75,062) |
Aggregate household income in Au Sable in 2022: $2,946,293
Median non-family income in Au Sable in 2022:| Au Sable: | $23,021 |
| State: | $37,265 |
Change in median non-family income between 2000 and 2022:| Au Sable, New York: | +104.6% |
| State: | +81.7% |
Median per capita income in Au Sable in 2022:| Au Sable: | $6,385 |
| State: | $31,947 |
Income statistics for Asian residents
Aggregate household income in Au Sable in 2022: $622,507
Median per capita income in Au Sable in 2022:| Au Sable: | $11,803 |
| State: | $46,726 |
Income statistics for Hispanic or Latino residents
Median household income in Au Sable, NY in 2022:| Au Sable: | $50,912 |
| State: | $60,468 |
Number of households with income < $10k:| Au Sable: | 10.0% (122,418) |
| New York: | 9.9% (127,185) |
Number of households with income $10k - 20k:| Au Sable: | 10.7% (131,778) |
| State: | 10.7% (136,699) |
Number of households with income $20k - 30k:| Au Sable: | 8.1% (99,230) |
| New York: | 8.1% (102,991) |
Number of households with income $30k - 40k:| Au Sable: | 7.8% (96,115) |
| State: | 7.8% (100,149) |
Number of households with income $40k - 50k:| Au Sable: | 6.8% (84,093) |
| New York: | 6.9% (87,760) |
Number of households with income $50k - 60k:| Au Sable: | 6.3% (77,872) |
| State: | 6.3% (80,968) |
Number of households with income $60k - 75k:| Au Sable: | 8.6% (106,140) |
| State: | 8.7% (110,631) |
Number of households with income $75k - 100k:| Au Sable: | 11.2% (137,004) |
| State: | 11.2% (142,787) |
Number of households with income $100k - 125k:| Au Sable: | 8.2% (100,394) |
| New York: | 8.2% (104,850) |
Number of households with income $125k - 150k:| Au Sable: | 6.3% (77,029) |
| State: | 6.3% (80,274) |
Number of households with income $150k - 200k:| Au Sable: | 7.4% (91,060) |
| State: | 7.4% (95,117) |
Number of households with income > $200k:| Au Sable: | 8.6% (105,018) |
| New York: | 8.6% (109,514) |
Aggregate household income in Au Sable in 2022: $1,937,800
Median family income in Au Sable in 2022:| Au Sable: | $70,910 |
| State: | $68,770 |
Number of families with income < $10k:| Au Sable: | 10.3% (15) |
| New York: | 6.9% (58,565) |
Number of families with income $10k - 20k:| Au Sable: | 14.6% (21) |
| State: | 7.0% (59,058) |
Number of families with income $20k - 30k:| Au Sable: | 15.9% (23) |
| State: | 8.0% (68,048) |
Number of families with income $30k - 40k:| Au Sable: | 14.9% (21) |
| State: | 8.4% (70,668) |
Number of families with income $40k - 50k:| Au Sable: | 12.2% (17) |
| State: | 7.4% (62,941) |
Number of families with income $50k - 60k:| Au Sable: | 6.3% (9) |
| State: | 6.6% (55,592) |
Number of families with income $60k - 75k:| Au Sable: | 11.3% (16) |
| State: | 9.3% (78,564) |
Number of families with income $75k - 100k:| Au Sable: | 5.6% (8) |
| New York: | 12.6% (106,685) |
Number of families with income $100k - 125k:| Au Sable: | 4.1% (6) |
| New York: | 9.4% (79,139) |
Number of families with income $125k - 150k:| Au Sable: | 3.4% (5) |
| New York: | 6.9% (58,255) |
Number of families with income > $200k:| Au Sable: | 1.3% (2) |
| New York: | 9.3% (78,555) |
Median per capita income in Au Sable in 2022:| Au Sable: | $28,916 |
| New York: | $29,761 |
Change in median per capita income between 2000 and 2022:| Au Sable, New York: | +20.2% |
| State: | +132.7% |
Income statistics for American Indian and Alaska Native residents
Aggregate household income in Au Sable in 2022: $252,714
Median per capita income in Au Sable in 2022:| Au Sable: | $20,100 |
| State: | $25,837 |
Change in median per capita income between 2000 and 2022:| Au Sable, New York: | +75.0% |
| New York: | +99.6% |
Income statistics for Multirace residents
Median household income in Au Sable, NY in 2022:| Au Sable: | $32,271 |
| State: | $73,557 |
Number of households with income < $10k:| Au Sable: | 8.9% (31,682) |
| New York: | 8.9% (57,924) |
Number of households with income $10k - 20k:| Au Sable: | 8.7% (30,898) |
| State: | 8.7% (56,590) |
Number of households with income $20k - 30k:| Au Sable: | 7.1% (25,257) |
| New York: | 7.1% (46,287) |
Number of households with income $30k - 40k:| Au Sable: | 6.9% (24,601) |
| State: | 6.9% (45,132) |
Number of households with income $40k - 50k:| Au Sable: | 5.8% (20,643) |
| State: | 5.8% (37,946) |
Number of households with income $50k - 60k:| Au Sable: | 5.6% (19,834) |
| State: | 5.6% (36,410) |
Number of households with income $60k - 75k:| Au Sable: | 7.8% (27,667) |
| State: | 7.8% (50,819) |
Number of households with income $75k - 100k:| Au Sable: | 11.7% (41,459) |
| State: | 11.7% (76,024) |
Number of households with income $100k - 125k:| Au Sable: | 9.3% (32,992) |
| New York: | 9.3% (60,635) |
Number of households with income $125k - 150k:| Au Sable: | 6.2% (22,106) |
| State: | 6.2% (40,533) |
Number of households with income $150k - 200k:| Au Sable: | 8.6% (30,751) |
| State: | 8.6% (56,409) |
Number of households with income > $200k:| Au Sable: | 13.4% (47,740) |
| New York: | 13.4% (87,442) |
Aggregate household income in Au Sable in 2022: $3,281,391
Median family income in Au Sable in 2022:| Au Sable: | $34,314 |
| New York: | $85,788 |
Number of families with income $30k - 40k:| Au Sable: | 32.0% (15) |
| State: | 6.5% (26,239) |
Number of families with income $100k - 125k:| Au Sable: | 68.0% (32) |
| State: | 10.7% (43,036) |
Median non-family income in Au Sable in 2022:| Au Sable: | $32,299 |
| State: | $46,403 |
Change in median non-family income between 2000 and 2022:| Au Sable, New York: | +52.0% |
| State: | +113.6% |
Median per capita income in Au Sable in 2022:| Au Sable: | $27,446 |
| State: | $36,931 |
Change in median per capita income between 2000 and 2022:| Au Sable, New York: | +107.2% |
| State: | +158.8% |