Housing density: 1,185 houses/condos per square mile
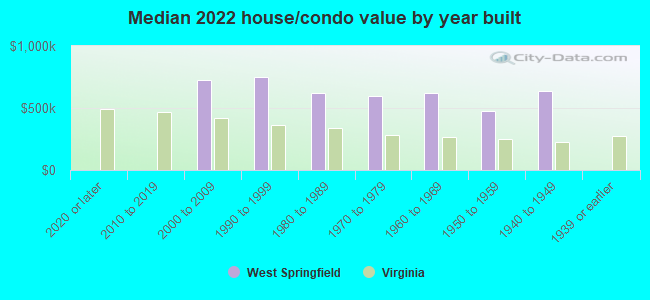
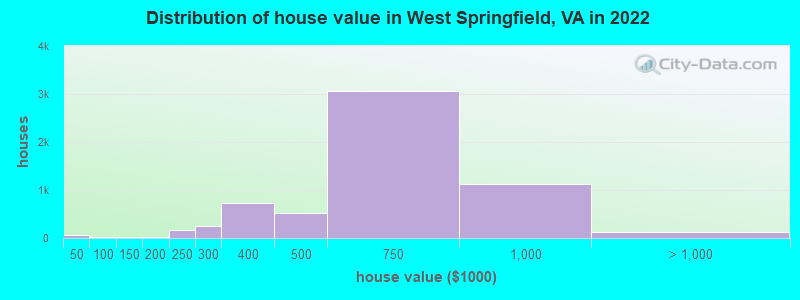
Median price asked for vacant for-sale houses and condos in 2022: $511,545.
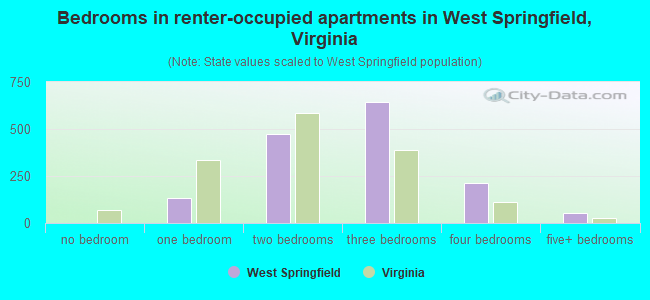
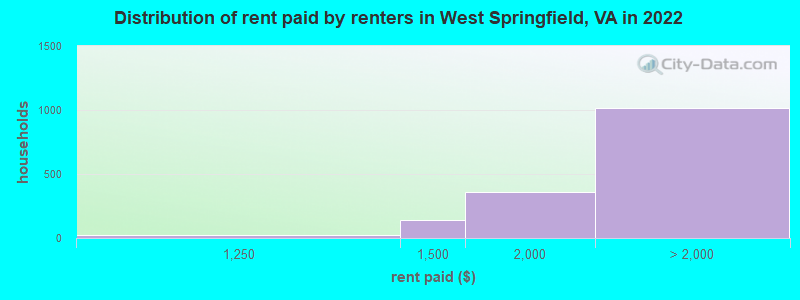
Median contract rent in 2022: over $2,000 (lower quartile is $1,793, upper quartile is over $2,000)
Median rent asked for vacant for-rent units in 2022: $2,475
Median gross rent in West Springfield, VA in 2022: over $2,000
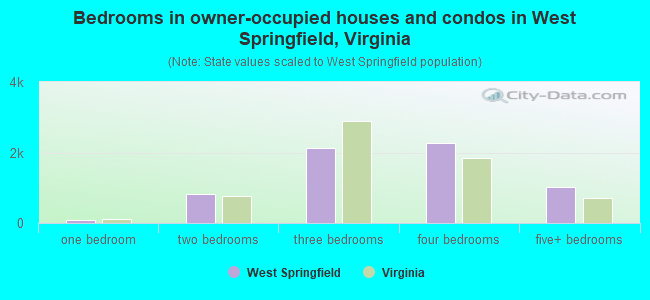
Housing units in West Springfield with a mortgage: 4,475 (402 second mortgage, 6 home equity loan, 359 both second mortgage and home equity loan) Houses without a mortgage: 75
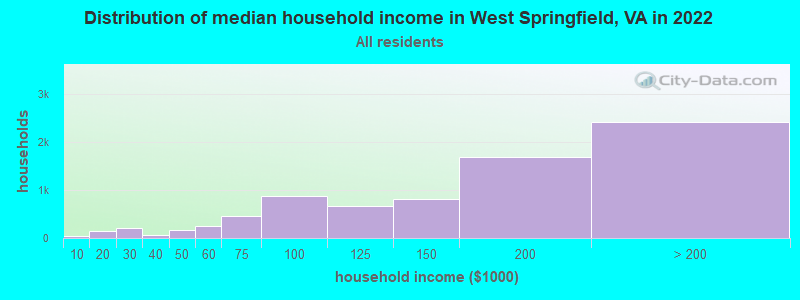
Median household income for houses/condos with a mortgage: $179,478
Median household income for apartments without a mortgage: $139,684
Median monthly housing costs: $2,295
Compare current foreclosures near West Springfield, VA:
#1
$179,900
Old Fort Rd
Fort Washington, MD 20744
721
sq. feet
1
baths
2
beds
#2
$300,000
Henson Ln
Temple Hills, MD 20748
1,566
sq. feet
2
baths
3
beds
#3
$265,900
Crafford Pl
Fort Washington, MD 20744
1,890
sq. feet
1
baths
3
beds
#4
$359,900
Wilson Ln Apt 204
Mc Lean, VA 22102
925
sq. feet
1
baths
2
beds
#5
$259,900
Cathedral Ave NW Apt 108
Washington, DC 20016
765
sq. feet
1
baths
1
beds
#6
$325,000
Buchanan St NE
Washington, DC 20017
1,240
sq. feet
2
baths
3
beds
#7
$395,000
17th St NW Apt 504
Washington, DC 20009
800
sq. feet
1
baths
1
beds
#8
$665,000
Monroe St NW
Washington, DC 20010
-
sq. feet
2
baths
2
beds
#9
$1,574,900
19th St NW
Washington, DC 20036
2,515
sq. feet
6
baths
8
beds
#10
$139,900
Delaware Ave SW Apt N720
Washington, DC 20024
-
sq. feet
1
baths
1
beds
#11
$307,500
T St SE Apt 3
Washington, DC 20020
-
sq. feet
2
baths
4
beds
#12
$99,750
Wilson Bridge Dr Unit #6770 A-2
Oxon Hill, MD 20745
-
sq. feet
1
baths
1
beds
#13
Oakwood St SE Apt B5
Washington, DC 20032
628
sq. feet
1
baths
1
beds
#14
Yoakum Pkwy Apt 22304
Alexandria, VA 22304
1,098
sq. feet
2
baths
1
beds
#15
Snowfall Dr
Manassas, VA 20112
1,520
sq. feet
3
baths
3
beds
#16
Adams St NE Apt 1
Washington, DC 20018
697
sq. feet
2
baths
2
beds
#17
Wilson Boulevard, Unit 101, Falls Church, Va 22044
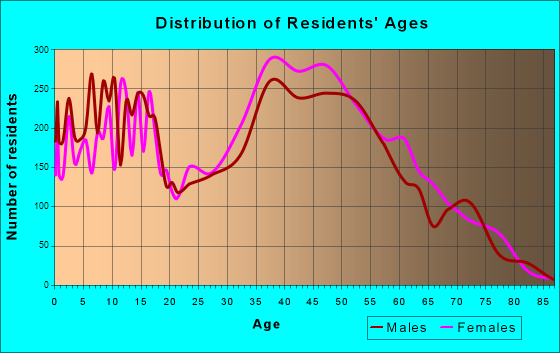
4,230 married couples with children.
876 single-parent households (160 men, 716 women).
63.4% of residents of West Springfield speak English at home.
13.7% of residents speak Spanish at home (68% speak English very well, 15% speak English well, 13% speak English not well, 3% don't speak English at all).
8.8% of residents speak other Indo-European language at home (73% speak English very well, 19% speak English well, 5% speak English not well, 2% don't speak English at all).
8.4% of residents speak Asian or Pacific Island language at home (46% speak English very well, 32% speak English well, 20% speak English not well, 3% don't speak English at all).
5.2% of residents speak other language at home (75% speak English very well, 22% speak English well, 2% speak English not well).
Foreign born population: 5,933 (25.5%)
(66.6% of them are naturalized citizens)
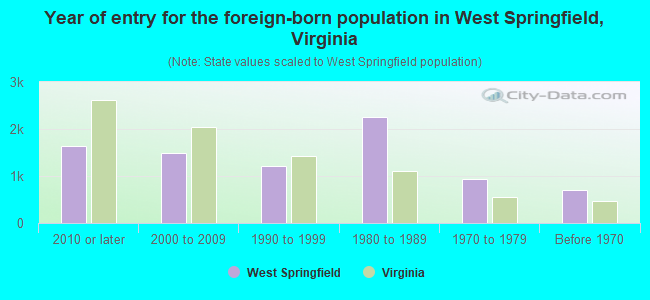
Year of entry for the foreign-born population in West Springfield, Virginia
1,6312010 or later
1,4832000 to 2009
1,2091990 to 1999
2,2481980 to 1989
9341970 to 1979
694Before 1970
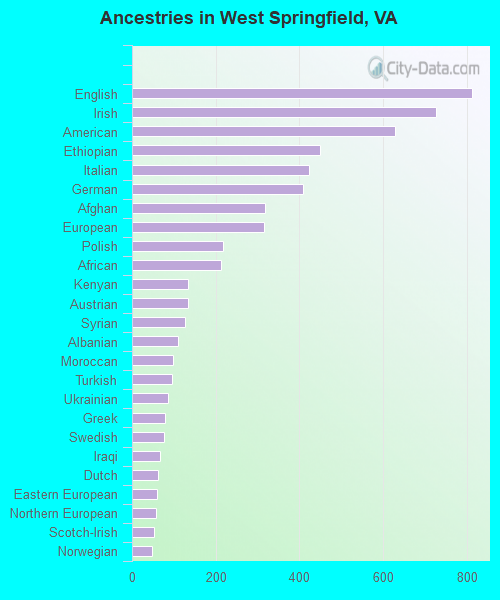
First ancestries reported:
English: 813 (6.3%)
Irish: 728 (5.6%)
American: 630 (4.8%)
Ethiopian: 449 (3.5%)
Italian: 423 (3.3%)
German: 408 (3.1%)
Afghan: 317 (2.4%)
European: 316 (2.4%)
Polish: 217 (1.7%)
African: 214 (1.6%)
Kenyan: 135 (1.0%)
Austrian: 133 (1.0%)
Syrian: 126 (1.0%)
Albanian: 110 (0.8%)
Moroccan: 99 (0.8%)
Turkish: 95 (0.7%)
Ukrainian: 86 (0.7%)
Greek: 78 (0.6%)
Swedish: 77 (0.6%)
Iraqi: 67 (0.5%)
Dutch: 63 (0.5%)
Eastern European: 59 (0.5%)
Northern European: 57 (0.4%)
Scotch-Irish: 53 (0.4%)
Norwegian: 47 (0.4%)
Scottish: 47 (0.4%)
French: 42 (0.3%)
Jamaican: 41 (0.3%)
Armenian: 40 (0.3%)
Scandinavian: 38 (0.3%)
Somali: 38 (0.3%)
Egyptian: 38 (0.3%)
Hungarian: 27 (0.2%)
Portuguese: 25 (0.2%)
British: 24 (0.2%)
Lebanese: 20 (0.2%)
Russian: 19 (0.1%)
Swiss: 18 (0.1%)
Romanian: 16 (0.1%)
Trinidadian and Tobagonian: 13 (0.1%)
Finnish: 11 (0.08%)
Czechoslovakian: 11 (0.08%)
Palestinian: 11 (0.08%)
Lithuanian: 9 (0.07%)
Macedonian: 9 (0.07%)
Danish: 9 (0.07%)
Canadian: 8 (0.06%)
Czech: 7 (0.05%)
Bulgarian: 7 (0.05%)
Slovak: 7 (0.05%)
Pennsylvania German: 6 (0.05%)
Assyrian: 6 (0.05%)
Haitian: 5 (0.04%)
Arab: 3 (0.02%)
Slovene: 2 (0.02%)
Ghanaian: 2 (0.02%)
Welsh: 2 (0.02%)
Most common places of birth for foreign-born residents (%):
Korea
West Springfield:
9.9% (586)
Virginia:
4.9% (52,857)
Vietnam
West Springfield:
8.1% (482)
Virginia:
4.2% (45,750)
Peru
West Springfield:
7.5% (445)
Virginia:
2.4% (26,366)
Ethiopia
West Springfield:
6.2% (368)
Virginia:
2.9% (32,082)
El Salvador
West Springfield:
5.2% (309)
Virginia:
9.9% (107,534)
Philippines
West Springfield:
5.0% (297)
Virginia:
4.8% (52,629)
Afghanistan
West Springfield:
4.3% (258)
Virginia:
1.8% (19,426)
Pakistan
West Springfield:
4.2% (250)
Virginia:
2.3% (24,582)
India
West Springfield:
3.4% (203)
Virginia:
9.0% (97,830)
Colombia
West Springfield:
3.4% (199)
Virginia:
1.3% (14,435)
Bolivia
West Springfield:
2.8% (167)
Virginia:
2.4% (25,722)
Argentina
West Springfield:
2.1% (122)
Virginia:
0.5% (4,997)
Venezuela
West Springfield:
1.8% (108)
Virginia:
0.8% (8,186)
Bangladesh
West Springfield:
1.7% (99)
Virginia:
1.1% (12,049)
Cuba
West Springfield:
1.5% (89)
Virginia:
0.5% (5,899)
Place of birth for U.S.-born residents:
This state: 6,379
Other state: 10,150
Northeast: 2,915
Midwest: 1,978
South: 3,697
West: 1,525
85.4% of West Springfield residents lived in the same house 1 years ago. Out of people who lived in different houses, 33.8% lived in this county. Out of people who lived in different counties, 39.8% lived in Virginia.
West Springfield:
85.4%
State average:
86.6%
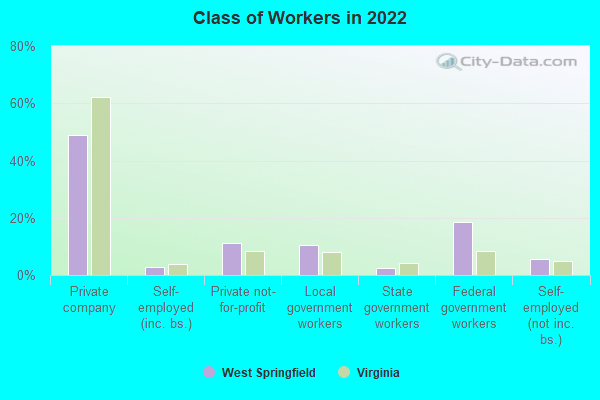
Education attainment for males 25 years and older:
No schooling: 84
Nursery to 4th grade: 10
5th and 6th grade: 33
7th and 8th grade: 30
9th grade: 33
10th grade: 1
11th grade: 9
12th grade, no diploma: 69
High school graduate (or equivalency): 1,090
Less than 1 year of college: 188
Some college more than 1 year, no degree: 534
Associate degree: 633
Bachelor's degree: 2,243
Master's degree: 1,835
Professional school degree: 502
Doctorate degree: 330
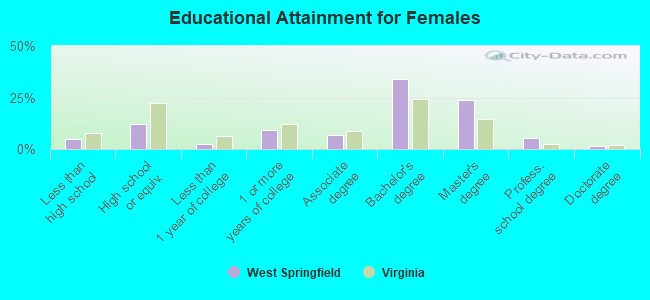
Education attainment for females 25 years and older:
No schooling: 130
Nursery to 4th grade: 22
5th and 6th grade: 0
7th and 8th grade: 8
9th grade: 75
10th grade: 1
11th grade: 22
12th grade, no diploma: 128
High school graduate (or equivalency): 984
Less than 1 year of college: 186
Some college more than 1 year, no degree: 721
Associate degree: 555
Bachelor's degree: 2,709
Master's degree: 1,910
Professional school degree: 443
Doctorate degree: 129
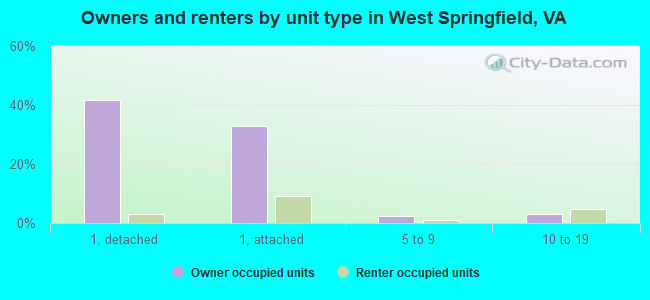
Housing units in structures:
One, detached: 3,581
One, attached: 3,083
Two: 38
3 or 4: 81
5 to 9: 242
10 to 19: 799
20 to 49: 227
50 or more: 22
Mobile homes: 9
Housing units lacking complete kitchen facilities in 2022: 0.1%
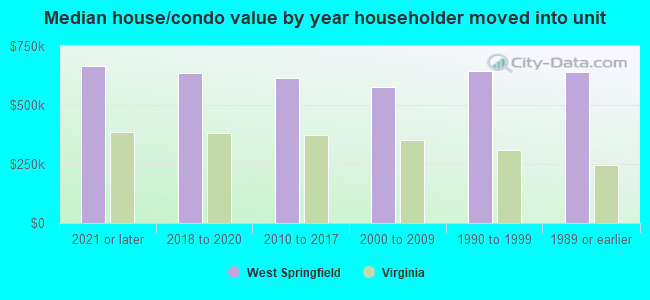
House/condo owner moved in on average 14 years ago