Washington, NY (New York) Houses and Residents
| Washington: | $478,939 |
| New York: | $400,400 |
Total population: 4,741 (Urban population: 0, Rural population: 4,742 (88 farm, 4,654 nonfarm))
Houses: 2,192 (1,914 occupied: 1,201 owner occupied, 713 renter occupied)
| % of renters here: | 37% |
| State: | 46% |
Housing density: 37 houses/condos per square mile
Median price asked for vacant for-sale houses and condos in 2022 in this county: $304,174.
Median contract rent in 2022: $1,282 (lower quartile is $1,044, upper quartile is $1,705)
Median rent asked for vacant for-rent units in 2022: $1,619
Median gross rent in Washington, NY in 2022: $1,488
Housing units in Washington with a mortgage: 620 (43 second mortgage, 108 home equity loan, 6 both second mortgage and home equity loan)
Houses without a mortgage: 261
Compare current foreclosures near Washington, NY:
| Photo | Address | Area | Beds / Baths | Price | Details |
|---|---|---|---|---|---|

|
#1
Route 82
Clinton Corners, NY 12514
|
2,478 sq. feet
|
3 baths 3 beds |
$475,900
|
show details |

|
#2
Tinkertown Rd
Pleasant Valley, NY 12569
|
2,970 sq. feet
|
2 baths 3 beds |
$469,900
|
show details |

|
#3
Church St
Poughkeepsie, NY 12601
|
1,521 sq. feet
|
1 baths 4 beds |
$25,000
|
show details |

|
#4
Salt Point Tpke
Clinton Corners, NY 12514
|
1,148 sq. feet
|
1 baths 3 beds |
$254,900
|
show details |

|
#5
Broadview Rd
Poughkeepsie, NY 12603
|
1,883 sq. feet
|
2 baths 4 beds |
show details | |

|
#6
Pine Cone Ct
Poughkeepsie, NY 12603
|
936 sq. feet
|
1 baths 1 beds |
show details | |

|
#7
Browns Pond Rd
Staatsburg, NY 12580
|
3,944 sq. feet
|
5 baths 5 beds |
show details | |

|
#8
Richard Rd
Hyde Park, NY 12538
|
2,572 sq. feet
|
3 baths 3 beds |
show details | |

|
#9
Roosevelt Rd
Hyde Park, NY 12538
|
1,566 sq. feet
|
2 baths 4 beds |
show details | |

|
#10
Vanessa Ln
Staatsburg, NY 12580
|
1,863 sq. feet
|
2 baths 4 beds |
show details |
| Photo | Address | Area | Beds / Baths | Price | Details |
|---|---|---|---|---|---|

|
#11
Darrow Pl
Poughkeepsie, NY 12603
|
1,554 sq. feet
|
2 baths 3 beds |
show details | |

|
#12
Gray St
Poughkeepsie, NY 12603
|
2,880 sq. feet
|
2 baths 4 beds |
show details | |

|
#13
Lilac Dr
Wingdale, NY 12594
|
1,516 sq. feet
|
2 baths 3 beds |
show details | |

|
#14
Lawrence Rd
Hyde Park, NY 12538
|
2,200 sq. feet
|
3 baths 5 beds |
show details | |

|
#15
Lilac Dr
Wingdale, NY 12594
|
936 sq. feet
|
1 baths 2 beds |
show details | |

|
#16
Daniels Ct
Poughkeepsie, NY 12603
|
1,435 sq. feet
|
2 baths 3 beds |
show details | |

|
#17
Haviland Rd
Poughkeepsie, NY 12601
|
1,800 sq. feet
|
1 baths 3 beds |
show details | |

|
#18
S Clinton St
Poughkeepsie, NY 12601
|
3,732 sq. feet
|
2 baths 8 beds |
show details | |

|
#19
Cardinal Rd
Hyde Park, NY 12538
|
2,692 sq. feet
|
2 baths 3 beds |
show details | |

|
#20
Virginia Ave
Poughkeepsie, NY 12601
|
1,504 sq. feet
|
2 baths 2 beds |
show details |
| Photo | Address | Area | Beds / Baths | Price | Details |
|---|---|---|---|---|---|

|
#21
Clapp Hill Rd
Lagrangeville, NY 12540
|
4,140 sq. feet
|
3 baths 3 beds |
show details | |

|
#22
Glenwood Ave
Poughkeepsie, NY 12603
|
1,035 sq. feet
|
1 baths 3 beds |
show details | |

|
#23
Stringham Rd Apt 4
Lagrangeville, NY 12540
|
1,534 sq. feet
|
2 baths 2 beds |
show details | |

|
#24
Mews Aly
Poughkeepsie, NY 12603
|
1,876 sq. feet
|
2 baths 3 beds |
show details | |

|
#25
Clove Valley Rd
Lagrangeville, NY 12540
|
2,688 sq. feet
|
3 baths 4 beds |
show details | |

|
#26
Bayberry St
Hopewell Junction, NY 12533
|
1,602 sq. feet
|
3 baths 3 beds |
show details | |

|
#27
Susan Dr
Poughquag, NY 12570
|
1,048 sq. feet
|
2 baths 3 beds |
show details | |

|
#28
Route 55
Lagrangeville, NY 12540
|
1,912 sq. feet
|
3 baths 3 beds |
show details | |

|
#29
S Randolph Ave
Poughkeepsie, NY 12601
|
1,718 sq. feet
|
2 baths 3 beds |
show details | |

|
#30
Quaker Hill Dr
Hyde Park, NY 12538
|
1,003 sq. feet
|
1 baths 3 beds |
show details |
| Photo | Address | Area | Beds / Baths | Price | Details |
|---|---|---|---|---|---|

|
#31
Mountain Lake Rd
New Preston Marble Dale, CT 06777
|
2,800 sq. feet
|
3 baths 4 beds |
show details | |

|
#32
Birchwood Way
Hopewell Junction, NY 12533
|
3,512 sq. feet
|
4 baths 4 beds |
show details | |

|
#33
Hamilton Rd
Hopewell Junction, NY 12533
|
2,468 sq. feet
|
3 baths 4 beds |
show details | |

|
#34
Adriance Ave
Poughkeepsie, NY 12601
|
2,854 sq. feet
|
4 baths 6 beds |
show details | |

|
#35
Creek Rd
Poughkeepsie, NY 12601
|
1,920 sq. feet
|
2 baths 3 beds |
show details | |

|
#36
Old Route 22
Millerton, NY 12546
|
1,806 sq. feet
|
2 baths 3 beds |
show details | |

|
#37
S White St
Poughkeepsie, NY 12601
|
2,548 sq. feet
|
2 baths 4 beds |
show details | |

|
#38
Bridgewater Way
Poughkeepsie, NY 12601
|
1,552 sq. feet
|
3 baths 3 beds |
show details | |

|
#39
Homer Pl
Poughkeepsie, NY 12603
|
1,674 sq. feet
|
2 baths 3 beds |
show details | |

|
#40
Waldorf Pl
Poughkeepsie, NY 12601
|
1,800 sq. feet
|
2 baths 3 beds |
show details |
| Photo | Address | Area | Beds / Baths | Price | Details |
|---|---|---|---|---|---|

|
#41
Woodland Dr
Poughquag, NY 12570
|
2,232 sq. feet
|
2 baths 6 beds |
show details | |

|
#42
Maplewood Dr
Rhinebeck, NY 12572
|
2,063 sq. feet
|
2 baths 2 beds |
show details | |

|
#43
Seitz Ter
Poughkeepsie, NY 12603
|
1,548 sq. feet
|
1 baths 3 beds |
show details | |

|
#44
Sheraton Dr
Poughkeepsie, NY 12601
|
1,248 sq. feet
|
1 baths 4 beds |
show details | |

|
#45
Ridge Rd
Hopewell Junction, NY 12533
|
1,280 sq. feet
|
2 baths 4 beds |
show details | |

|
#46
Marion Ave
Wappingers Falls, NY 12590
|
1,580 sq. feet
|
2 baths 3 beds |
show details | |

|
#47
Lake Rd
Pine Plains, NY 12567
|
3,112 sq. feet
|
4 baths 4 beds |
show details | |

|
#48
Rogers Pl
Hyde Park, NY 12538
|
1,404 sq. feet
|
1 baths 3 beds |
show details | |

|
#49
Titusville Rd
Poughkeepsie, NY 12603
|
1,110 sq. feet
|
1 baths 2 beds |
show details | |

|
Check over 1 million property listings on Foreclosure.com!
|
browse all offers | |||

Household type by relationship:
Households: 277,523- In family households: 233,367 (50,686 male householders, 22,209 female householders)
56,050 spouses, 84,341 children (79,509 natural, 1,840 adopted, 2,992 stepchildren), 4,231 grandchildren, 2,222 brothers or sisters, 2,827 parents, foster children, 2,945 other relatives, 5,949 non-relatives
- In nonfamily households: 44,156 (16,442 male householders (12,459 living alone)), 18,628 female householders (15,636 living alone)), 9,086 nonrelatives
- In group quarters: 19,965 (8,812 institutionalized population)
50,827 married couples with children.
13,342 single-parent households (2,993 men, 10,349 women).
91.9% of residents of Washington speak English at home.
3.1% of residents speak Spanish at home (38% speak English very well, 35% speak English well, 27% speak English not well).
3.8% of residents speak other Indo-European language at home (73% speak English very well, 13% speak English well, 13% speak English not well).
1.0% of residents speak Asian or Pacific Island language at home (55% speak English very well, 45% speak English well).
0.2% of residents speak other language at home (100% speak English very well).
Foreign born population: 486 (9.7%)
(75.5% of them are naturalized citizens)
| Here: | 7.9 |
| State: | 6.3 |
| Here: | 5.2 |
| State: | 3.8 |

- Bedrooms in owner-occupied houses and condos in Washington, New York
- 6no bedroom
- 231 bedroom
- 2032 bedrooms
- 5443 bedrooms
- 2864 bedrooms
- 1395+ bedrooms

- Bedrooms in renter-occupied apartments in Washington, New York
- 14no bedroom
- 2601 bedroom
- 2192 bedrooms
- 1643 bedrooms
- 434 bedrooms
- 135+ bedrooms

- Cars and other vehicles available in Washington in owner-occupied houses/condos
- 36no vehicle
- 2861 vehicle
- 6002 vehicles
- 2243 vehicles
- 444 vehicles
- 115+ vehicles

- Cars and other vehicles available in Washington in renter-occupied apartments
- 82no vehicle
- 3621 vehicle
- 2022 vehicles
- 533 vehicles
- 74 vehicles
- 75+ vehicles

- Rooms in owner-occupied houses in Washington, New York
- 61 room
- 52 rooms
- 143 rooms
- 724 rooms
- 1375 rooms
- 2886 rooms
- 1567 rooms
- 2298 rooms
- 2949+ rooms

- Rooms in renter-occupied apartments in Washington, New York
- 141 room
- 732 rooms
- 1833 rooms
- 1744 rooms
- 1005 rooms
- 736 rooms
- 517 rooms
- 278 rooms
- 189+ rooms


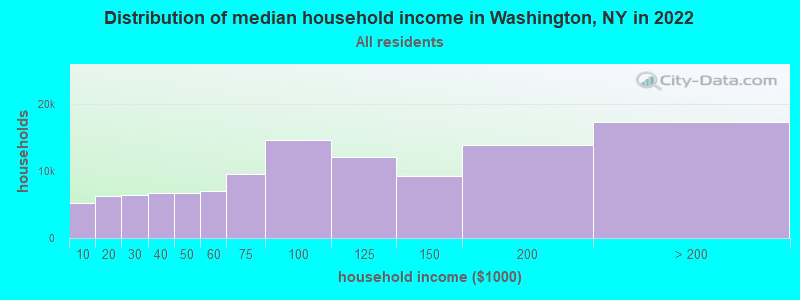
Washington, NY household income distribution

- 5,221Less than $10,000
- 6,253$10,000 to $19,999
- 6,365$20,000 to $29,999
- 6,773$30,000 to $39,999
- 6,761$40,000 to $49,999
- 6,947$50,000 to $59,999
- 9,606$60,000 to $74,999
- 14,619$75,000 to $99,999
- 12,026$100,000 to $124,999
- 9,212$125,000 to $149,999
- 13,803$150,000 to $199,999
- 17,276$200,000 or more
Percentage of workers working in this county: 84.8%
Number of people working at home: 414 (15.7% of all workers)
Travel time to work (commute)
- Less than 5 minutes: 173
- 5 to 9 minutes: 346
- 10 to 14 minutes: 194
- 15 to 19 minutes: 198
- 20 to 24 minutes: 192
- 25 to 29 minutes: 171
- 30 to 34 minutes: 354
- 35 to 39 minutes: 108
- 40 to 44 minutes: 72
- 45 to 59 minutes: 106
- 60 to 89 minutes: 97
- 90 or more minutes: 122
Means of transportation to work:
- Drove a car alone: 1,703 (74.3%)
- Carpooled: 174 (7.6%)
- Bus or trolley bus: 5 (0.2%)
- Subway or elevated: 4 (0.2%)
- Railroad: 40 (1.7%)
- Taxi: 26 (1.1%)
- Bicycle: 8 (0.3%)
- Walked: 155 (6.8%)
- Other means: 18 (0.8%)
- Worked at home: 159 (6.9%)


- Year of entry for the foreign-born population in Washington, New York
- 381995 to March 2000
- 201990 to 1994
- 401985 to 1989
- 131980 to 1984
- 351975 to 1979
- 81970 to 1974
- 81965 to 1969
- 157Before 1965

First ancestries reported:
- Irish: 1,241 (20.4%)
- Italian: 1,180 (19.4%)
- German: 795 (13.1%)
- English: 756 (12.4%)
- Other: 555 (9.1%)
- United States: 267 (4.4%)
- Polish: 193 (3.2%)
- Scottish: 165 (2.7%)
- Dutch: 143 (2.4%)
- French: 133 (2.2%)
- French Canadian: 124 (2.0%)
- Swedish: 114 (1.9%)
- Scotch-Irish: 82 (1.3%)
- Greek: 56 (0.9%)
- Russian: 55 (0.9%)
- Hungarian: 39 (0.6%)
- Norwegian: 35 (0.6%)
- Danish: 28 (0.5%)
- Portuguese: 22 (0.4%)
- Czech: 18 (0.3%)
- Lithuanian: 17 (0.3%)
- Swiss: 17 (0.3%)
- Welsh: 16 (0.3%)
- West Indian: 14 (0.2%)
- Ukrainian: 9 (0.1%)
- Slovak: 6 (0.10%)
- Subsaharan African: 5 (0.08%)
Most common places of birth for foreign-born residents (%):
| Washington: | 16.0% (51) |
| New York: | 1.6% (62,237) |
| Washington: | 14.4% (46) |
| New York: | 1.8% (69,327) |
| Washington: | 7.5% (24) |
| New York: | 4.2% (161,189) |
| Washington: | 7.2% (23) |
| New York: | 3.8% (147,729) |
| Washington: | 5.6% (18) |
| New York: | 0.3% (11,299) |
| Washington: | 4.1% (13) |
| New York: | 1.1% (41,934) |
| Washington: | 4.1% (13) |
| New York: | 1.4% (54,876) |
| Washington: | 3.4% (11) |
| New York: | 0.2% (6,545) |
| Washington: | 3.1% (10) |
| New York: | 2.4% (93,187) |
| Washington: | 2.8% (9) |
| New York: | 0.2% (7,839) |
| Washington: | 2.8% (9) |
| New York: | 0.6% (25,059) |
| Washington: | 2.5% (8) |
| New York: | 0.3% (11,866) |
| Washington: | 2.2% (7) |
| New York: | 1.0% (37,496) |
| Washington: | 2.2% (7) |
| New York: | 1.9% (72,408) |
| Washington: | 2.2% (7) |
| New York: | 0.4% (16,228) |
| Washington: | 2.2% (7) |
| New York: | 0.6% (22,265) |
| Washington: | 1.9% (6) |
| New York: | 0.5% (20,310) |
| Washington: | 1.9% (6) |
| New York: | 0.8% (30,473) |
| Washington: | 1.9% (6) |
| New York: | 0.0% (1,294) |
| Washington: | 1.6% (5) |
| New York: | 0.3% (10,672) |
| Washington: | 1.6% (5) |
| New York: | 0.1% (4,273) |
| Washington: | 1.6% (5) |
| New York: | 0.9% (33,208) |
| Washington: | 1.6% (5) |
| New York: | 2.9% (111,727) |
Place of birth for U.S.-born residents:
- This state: 3,126
- Other state: 1,255
- Northeast: 886
- Midwest: 173
- South: 162
- West: 34
63% of Washington residents lived in the same house 5 years ago.
Out of people who lived in different houses, 57% lived in this county.
Out of people who lived in different counties, 61% lived in New York.
Education attainment for males 25 years and older:
- No schooling: 5
- Nursery to 4th grade: 0
- 5th and 6th grade: 24
- 7th and 8th grade: 26
- 9th grade: 14
- 10th grade: 17
- 11th grade: 31
- 12th grade, no diploma: 37
- High school graduate (or equivalency): 446
- Less than 1 year of college: 130
- Some college more than 1 year, no degree: 206
- Associate degree: 111
- Bachelor's degree: 293
- Master's degree: 106
- Professional school degree: 89
- Doctorate degree: 41

Education attainment for females 25 years and older:
- No schooling: 7
- Nursery to 4th grade: 18
- 5th and 6th grade: 19
- 7th and 8th grade: 32
- 9th grade: 11
- 10th grade: 27
- 11th grade: 24
- 12th grade, no diploma: 5
- High school graduate (or equivalency): 486
- Less than 1 year of college: 150
- Some college more than 1 year, no degree: 153
- Associate degree: 221
- Bachelor's degree: 376
- Master's degree: 145
- Professional school degree: 39
- Doctorate degree: 14


Housing units in structures:
- One, detached: 1,550
- One, attached: 67
- Two: 199
- 3 or 4: 167
- 5 to 9: 123
- 10 to 19: 35
- 20 to 49: 13
- 50 or more: 23
- Mobile homes: 12
- Boats, RVs, vans, etc.: 3
Median worth of mobile homes: $24,471
Housing units lacking complete kitchen facilities: 0.4%

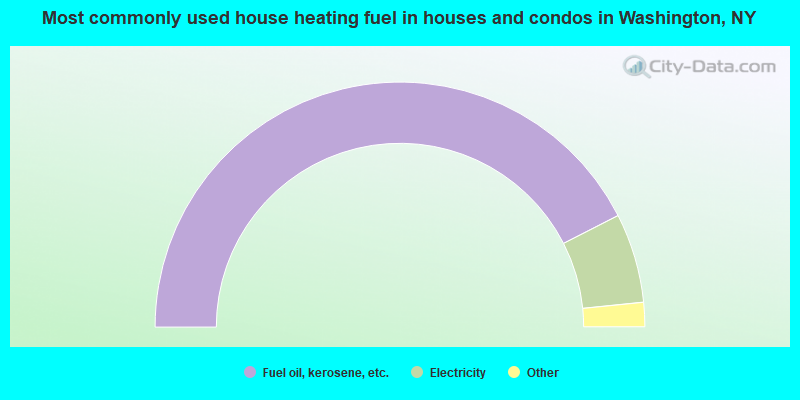
- 84.9%Fuel oil, kerosene, etc.
- 11.8%Electricity
- 1.7%Wood
- 1.1%Bottled, tank, or LP gas
- 0.4%Other fuel
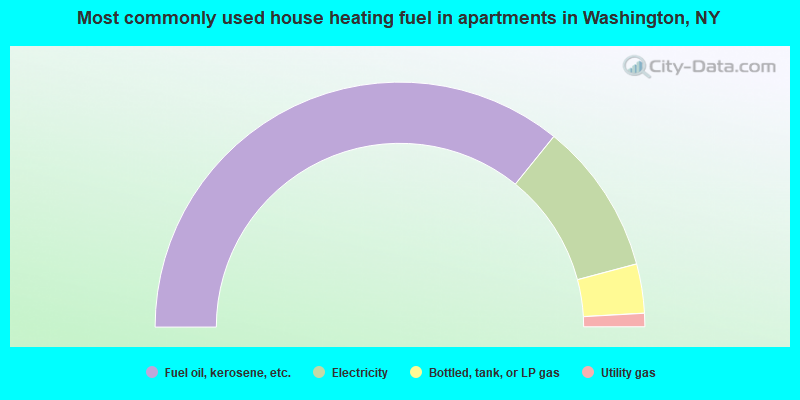
- 71.7%Fuel oil, kerosene, etc.
- 20.1%Electricity
- 6.5%Bottled, tank, or LP gas
- 1.8%Utility gas
Private vs. public school enrollment:
| Here: | 17.4% |
| New York: | 14.0% |
| Here: | 24.1% |
| New York: | 13.2% |
| Here: | 11.9% |
| New York: | 38.2% |


