Spring Valley, NY (New York) Houses and Residents
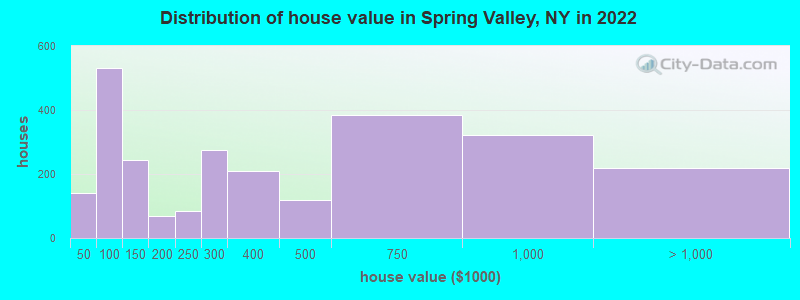
Estimated median house or condo value in 2022: $315,580 (it was $132,700 in 2000 )
Spring Valley:
$315,580New York:
$400,400
Lower value quartile - upper value quartile: $124,413 - $694,821Mean price in 2022: Detached houses: $710,331 Here:
$710,331State:
$476,719
Townhouses or other attached units: $469,494 Here:
$469,494State:
$699,270
In 2-unit structures: $685,420 Here:
$685,420State:
$713,077
In 3-to-4-unit structures: $155,826 Here:
$155,826State:
$764,568
In 5-or-more-unit structures: $213,363 Here:
$213,363State:
$912,009
Total population: 32,510 (Urban population: 25,374, Rural population: 0)
Houses: 10,241 (9,594 occupied: 2,452 owner occupied, 7,206 renter occupied )
% of renters here:
75%State:
46%
Housing density: 4,875 houses/condos per square mile
Median price asked for vacant for-sale houses and condos in 2022: $87,192.
Median contract rent in 2022: $1,399 (lower quartile is $937, upper quartile is $1,711)
Median rent asked for vacant for-rent units in 2022: $3,262
Median gross rent in Spring Valley, NY in 2022: $1,563
Housing units in Spring Valley with a mortgage: 1,374 (112 second mortgage, 7 home equity loan, 88 both second mortgage and home equity loan )Houses without a mortgage: 9
Median household income for houses/condos with a mortgage: $93,125
Median household income for apartments without a mortgage: $52,791
Median monthly housing costs: $1,522
Data:
Median house or condo value ($)
Median house or condo value ($ change since 2000)
Median house or condo value ($) - White
Median house or condo value ($) - Black or African American
Median house or condo value ($) - Asian
Median house or condo value ($) - Hispanic or Latino
Median house or condo value ($) - American Indian and Alaska Native
Median house or condo value ($) - Multirace
Median house or condo value ($) - Other Race
Median price asked for mobile homes ($)
Household density (households per square mile)
Mean house or condo value by units in structure - 1, detached ($)
Mean house or condo value by units in structure - 1, attached ($)
Mean house or condo value by units in structure - 2 ($)
Mean house or condo value by units in structure by units in structure - 3 or 4 ($)
Mean house or condo value by units in structure - 5 or more ($)
Mean house or condo value by units in structure - Boat, RV, van, etc. ($)
Mean house or condo value by units in structure - Mobile home ($)
Median contract rent ($)
Median contract rent - Lower quartile ($)
Median contract rent - Upper quartile ($)
Median gross rent ($)
Urban houses (%)
Rural houses (%)
Houses occupied (%)
Houses occupied (% change since 2000)
Houses owner occupied (%)
Houses owner occupied (% change since 2000)
Houses renter occupied (%)
Houses renter occupied (% change since 2000)
Vacant housing units - For rent (%)
Vacant housing units - For rent (% change since 2000)
Vacant housing units - For sale only (%)
Vacant housing units - For sale only (% change since 2000)
Vacant housing units - Rented or sold, not occupied (%)
Vacant housing units - Rented or sold, not occupied (% change since 2000)
Vacant housing units - For seasonal, recreational, or occasional use (%)
Vacant housing units - For seasonal, recreational, or occasional use (% change since 2000)
Vacant housing units - For migrant workers (%)
Vacant housing units - For migrant workers (% change since 2000)
Vacant housing units - Other vacant (%)
Vacant housing units - Other vacant (% change since 2000)
Median monthly housing costs ($)
Median household income for houses/condos with a mortgage ($)
Median household income for houses/condos without a mortgage ($)
Median household income ($)
Median household income ($) - White
Median household income ($) - Black or African American
Median household income ($) - Asian
Median household income ($) - Hispanic or Latino
Median household income ($) - American Indian and Alaska Native
Median household income ($) - Multirace
Median household income ($) - Other Race
Mortgage status - with mortgage (%)
Mortgage status - with second mortgage (%)
Mortgage status - with home equity loan (%)
Mortgage status - with both second mortgage and home equity loan (%)
Mortgage status - without a mortgage (%)
Median year house/condo built
Median year apartment built
Household type by relationship - Male householder living alone (%)
Household type by relationship - Male householder not living alone (%)
Household type by relationship - Female householder living alone (%)
Household type by relationship - Female householder not living alone (%)
Household type by relationship - Opposite-Sex spouse (%)
Household type by relationship - Same-Sex spouse (%)
Household type by relationship - Opposite-Sex unmarried partner (%)
Household type by relationship - Same-Sex unmarried partner (%)
Household type by relationship - In group quarters (%)
Size of family households - 2-person household (%)
Size of family households - 3-person household (%)
Size of family households - 4-person household (%)
Size of family households - 5-person household (%)
Size of family households - 6-person household (%)
Size of family households - 7-or-more-person household (%)
Size of nonfamily households - 1-person household (%)
Size of nonfamily households - 2-person household (%)
Size of nonfamily households - 3-person household (%)
Size of nonfamily households - 4-person household (%)
Size of nonfamily households - 5-person household (%)
Size of nonfamily households - 6-person household (%)
Size of nonfamily households - 7-or-moreperson household (%)
Year house built - Built 2010 or later (%)
Year house built - Built 2000 to 2009 (%)
Year house built - Built 1990 to 1999 (%)
Year house built - Built 1980 to 1989 (%)
Year house built - Built 1970 to 1979 (%)
Year house built - Built 1960 to 1969 (%)
Year house built - Built 1950 to 1959 (%)
Year house built - Built 1940 to 1949 (%)
Year house built - Built 1939 or earlier (%)
Median number of rooms in houses and condos
Median number of rooms in apartments
Median number of bedrooms in owner occupied houses
Mean number of bedrooms in owner occupied houses
Median number of bedrooms in renter occupied houses
Mean number of bedrooms in renter occupied houses
Median number of vehichles in owner occupied houses
Mean number of vehichles in owner occupied houses
Median number of vehichles in renter occupied houses
Mean number of vehichles in renter occupied houses
Rooms in owner-occupied houses - 1 room (%)
Rooms in owner-occupied houses - 2 rooms (%)
Rooms in owner-occupied houses - 3 rooms (%)
Rooms in owner-occupied houses - 4 rooms (%)
Rooms in owner-occupied houses - 5 rooms (%)
Rooms in owner-occupied houses - 6 rooms (%)
Rooms in owner-occupied houses - 7 rooms (%)
Rooms in owner-occupied houses - 8 rooms (%)
Rooms in owner-occupied houses - 9+ rooms (%)
Rooms in renter-occupied houses - 1 room (%)
Rooms in renter-occupied houses - 2 rooms (%)
Rooms in renter-occupied houses - 3 rooms (%)
Rooms in renter-occupied houses - 4 rooms (%)
Rooms in renter-occupied houses - 5 rooms (%)
Rooms in renter-occupied houses - 6 rooms (%)
Rooms in renter-occupied houses - 7 rooms (%)
Rooms in renter-occupied houses - 8 rooms (%)
Rooms in renter-occupied houses - 9+ rooms (%)
Bedrooms in owner-occupied houses - no bedrooms (%)
Bedrooms in owner-occupied houses - 1 bedroom (%)
Bedrooms in owner-occupied houses - 2 bedrooms (%)
Bedrooms in owner-occupied houses - 3 bedrooms (%)
Bedrooms in owner-occupied houses - 4 bedrooms (%)
Bedrooms in owner-occupied houses - 5+ bedrooms (%)
Bedrooms in renter-occupied houses - no bedrooms (%)
Bedrooms in renter-occupied houses - 1 bedroom (%)
Bedrooms in renter-occupied houses - 2 bedrooms (%)
Bedrooms in renter-occupied houses - 3 bedrooms (%)
Bedrooms in renter-occupied houses - 4 bedrooms (%)
Bedrooms in renter-occupied houses - 5+ bedrooms (%)
Vehicles available in owner-occupied houses - no vehicle available (%)
Vehicles available in owner-occupied houses - 1 vehicle available(%)
Vehicles available in owner-occupied houses - 2 Vehicles available (%)
Vehicles available in owner-occupied houses - 3 Vehicles available (%)
Vehicles available in owner-occupied houses - 4 Vehicles available (%)
Vehicles available in owner-occupied houses - 5+ Vehicles available (%)
Vehicles available in renter-occupied houses - no vehicle available (%)
Vehicles available in renter-occupied houses - 1 vehicle available (%)
Vehicles available in renter-occupied houses - 2 Vehicles available (%)
Vehicles available in renter-occupied houses - 3 Vehicles available (%)
Vehicles available in renter-occupied houses - 4 Vehicles available (%)
Vehicles available in renter-occupied houses - 5+ Vehicles available (%)
Housing units in structures - 1, detached (%)
Housing units in structures - 1, attached (%)
Housing units in structures - 2 (%)
Housing units in structures - 3 or 4 (%)
Housing units in structures - 5 to 9 (%)
Housing units in structures - 10 to 19 (%)
Housing units in structures - 20 to 49 (%)
Housing units in structures - 50 or more (%)
Housing units in structures - Mobile home (%)
Housing units in structures - Boat, RV, van, etc. (%)
Housing units in structures - Owners - 1, detached (%)
Housing units in structures - Owners - 1, attached (%)
Housing units in structures - Owners - 2 (%)
Housing units in structures - Owners - 3 or 4 (%)
Housing units in structures - Owners - 5 to 9 (%)
Housing units in structures - Owners - 10 to 19 (%)
Housing units in structures - Owners - 20 to 49 (%)
Housing units in structures - Owners - 50 or more (%)
Housing units in structures - Owners - Mobile home (%)
Housing units in structures - Owners - Boat, RV, van, etc. (%)
Housing units in structures - Renters - 1, detached (%)
Housing units in structures - Renters - 1, attached (%)
Housing units in structures - Renters - 2 (%)
Housing units in structures - Renters - 3 or 4 (%)
Housing units in structures - Renters - 5 to 9 (%)
Housing units in structures - Renters - 10 to 19 (%)
Housing units in structures - Renters - 20 to 49 (%)
Housing units in structures - Renters - 50 or more (%)
Housing units in structures - Renters - Mobile home (%)
Housing units in structures - Renters - Boat, RV, van, etc. (%)
House/condo owner moved in on average (years ago)
Renter moved in on average (years ago)
Year householder moved into unit - Moved in 1999 to March 2000 (%)
Year householder moved into unit - Moved in 1999 to March 2000 (%) - White
Year householder moved into unit - Moved in 1999 to March 2000 (%) - Black or African American
Year householder moved into unit - Moved in 1999 to March 2000 (%) - Asian
Year householder moved into unit - Moved in 1999 to March 2000 (%) - Hispanic or Latino
Year householder moved into unit - Moved in 1999 to March 2000 (%) - American Indian and Alaska Native
Year householder moved into unit - Moved in 1999 to March 2000 (%) - Multirace
Year householder moved into unit - Moved in 1999 to March 2000 (%) - Other Race
Year householder moved into unit - Moved in 1995 to 1998 (%)
Year householder moved into unit - Moved in 1995 to 1998 (%) - White
Year householder moved into unit - Moved in 1995 to 1998 (%) - Black or African American
Year householder moved into unit - Moved in 1995 to 1998 (%) - Asian
Year householder moved into unit - Moved in 1995 to 1998 (%) - Hispanic or Latino
Year householder moved into unit - Moved in 1995 to 1998 (%) - American Indian and Alaska Native
Year householder moved into unit - Moved in 1995 to 1998 (%) - Multirace
Year householder moved into unit - Moved in 1995 to 1998 (%) - Other Race
Year householder moved into unit - Moved in 1990 to 1994 (%)
Year householder moved into unit - Moved in 1990 to 1994 (%) - White
Year householder moved into unit - Moved in 1990 to 1994 (%) - Black or African American
Year householder moved into unit - Moved in 1990 to 1994 (%) - Asian
Year householder moved into unit - Moved in 1990 to 1994 (%) - Hispanic or Latino
Year householder moved into unit - Moved in 1990 to 1994 (%) - American Indian and Alaska Native
Year householder moved into unit - Moved in 1990 to 1994 (%) - Multirace
Year householder moved into unit - Moved in 1990 to 1994 (%) - Other Race
Year householder moved into unit - Moved in 1980 to 1989 (%)
Year householder moved into unit - Moved in 1980 to 1989 (%) - White
Year householder moved into unit - Moved in 1980 to 1989 (%) - Black or African American
Year householder moved into unit - Moved in 1980 to 1989 (%) - Asian
Year householder moved into unit - Moved in 1980 to 1989 (%) - Hispanic or Latino
Year householder moved into unit - Moved in 1980 to 1989 (%) - American Indian and Alaska Native
Year householder moved into unit - Moved in 1980 to 1989 (%) - Multirace
Year householder moved into unit - Moved in 1980 to 1989 (%) - Other Race
Year householder moved into unit - Moved in 1970 to 1979 (%)
Year householder moved into unit - Moved in 1970 to 1979 (%) - White
Year householder moved into unit - Moved in 1970 to 1979 (%) - Black or African American
Year householder moved into unit - Moved in 1970 to 1979 (%) - Asian
Year householder moved into unit - Moved in 1970 to 1979 (%) - Hispanic or Latino
Year householder moved into unit - Moved in 1970 to 1979 (%) - American Indian and Alaska Native
Year householder moved into unit - Moved in 1970 to 1979 (%) - Multirace
Year householder moved into unit - Moved in 1970 to 1979 (%) - Other Race
Year householder moved into unit - Moved in 1969 or earlier (%)
Year householder moved into unit - Moved in 1969 or earlier (%) - White
Year householder moved into unit - Moved in 1969 or earlier (%) - Black or African American
Year householder moved into unit - Moved in 1969 or earlier (%) - Asian
Year householder moved into unit - Moved in 1969 or earlier (%) - Hispanic or Latino
Year householder moved into unit - Moved in 1969 or earlier (%) - American Indian and Alaska Native
Year householder moved into unit - Moved in 1969 or earlier (%) - Multirace
Year householder moved into unit - Moved in 1969 or earlier (%) - Other Race
Housing units lacking complete plumbing facilities (%)
Housing units lacking complete kitchen facilities (%)
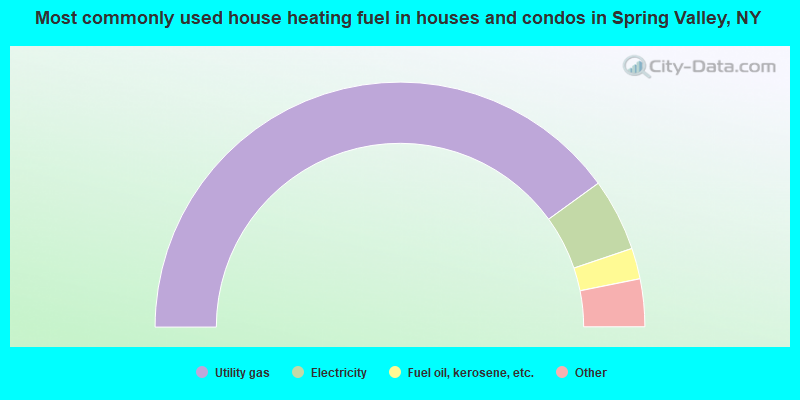
House heating fuel used in houses and condos - Utility gas (%)
House heating fuel used in houses and condos - Bottled, tank, or LP gas (%)
House heating fuel used in houses and condos - Electricity (%)
House heating fuel used in houses and condos - Fuel oil, kerosene, etc. (%)
House heating fuel used in houses and condos - Coal or coke (%)
House heating fuel used in houses and condos - Wood (%)
House heating fuel used in houses and condos - Solar energy (%)
House heating fuel used in houses and condos - Other fuel (%)
House heating fuel used in houses and condos - No fuel used (%)
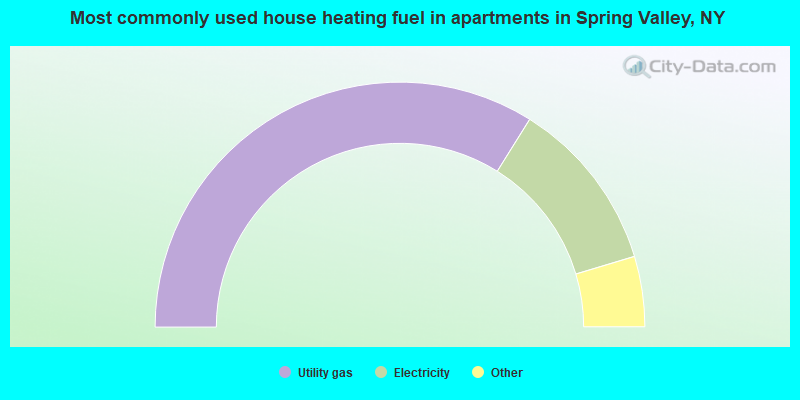
House heating fuel used in apartments - Utility gas (%)
House heating fuel used in apartments - Bottled, tank, or LP gas (%)
House heating fuel used in apartments - Electricity (%)
House heating fuel used in apartments - Fuel oil, kerosene, etc. (%)
House heating fuel used in apartments - Coal or coke (%)
House heating fuel used in apartments - Wood (%)
House heating fuel used in apartments - Solar energy (%)
House heating fuel used in apartments - Other fuel (%)
House heating fuel used in apartments - No fuel used (%)
Median year house/condo built: 1974Median year apartment built: 1970Household type by relationship:
Households: 33,128
Male householders: 5,159 (956 living alone ), Female householders: 4,415 (1,303 living alone )4,354 spouses (4,354 opposite-sex spouses ), 287 unmarried partners , (287 opposite-sex unmarried partners ), 14,191 children (13,777 natural , 117 adopted , 296 stepchildren ), 750 grandchildren , 725 brothers or sisters , 706 parents , 0 foster children , 1,280 other relatives , 1,119 non-relatives In group quarters: 136
Size of family households: 1,462 2-persons , 1,643 3-persons , 1,060 4-persons , 1,046 5-persons , 832 6-persons , 798 7-or-more-persons .
Size of nonfamily households: 2,622 1-person , 187 2-persons , 18 4-persons , 13 6-persons .
8,333 married couples with children. single-parent households (281 men , 1,936 women ).
27.4% of residents of Spring Valley speak English at home. of residents speak Spanish at home (48% speak English very well , 18% speak English well , 30% speak English not well , 4% don't speak English at all ).of residents speak other Indo-European language at home (37% speak English very well , 40% speak English well , 19% speak English not well , 4% don't speak English at all ).of residents speak Asian or Pacific Island language at home (34% speak English very well , 44% speak English well , 18% speak English not well , 4% don't speak English at all ).of residents speak other language at home (74% speak English very well , 22% speak English well , 2% speak English not well , 2% don't speak English at all ).
Foreign born population: 11,584 (35.0%)of them are naturalized citizens )
Median number of rooms in houses and condos:
Median number of rooms in apartments
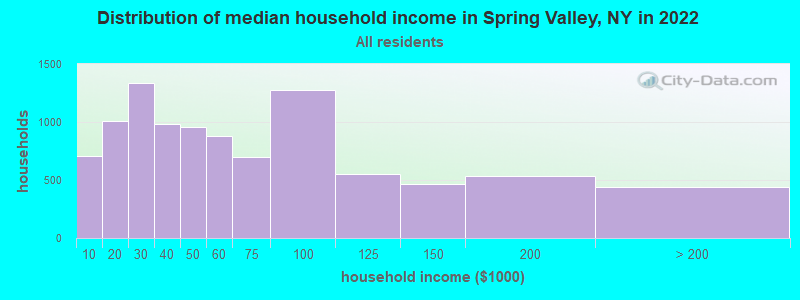
Spring Valley, NY household income distribution 705 Less than $10,0001,009 $10,000 to $19,9991,339 $20,000 to $29,999981 $30,000 to $39,999956 $40,000 to $49,999877 $50,000 to $59,999698 $60,000 to $74,9991,278 $75,000 to $99,999555 $100,000 to $124,999466 $125,000 to $149,999532 $150,000 to $199,999442 $200,000 or more
Home value of owner - occupied houses in 2022 in Spring Valley, NY 22 Less than $10,00015 $15,000 to $19,99918 $35,000 to $39,99984 $40,000 to $49,999132 $50,000 to $59,999113 $60,000 to $69,99984 $70,000 to $79,99969 $80,000 to $89,99945 $90,000 to $99,999101 $100,000 to $124,999142 $125,000 to $149,99951 $150,000 to $174,99917 $175,000 to $199,99982 $200,000 to $249,999274 $250,000 to $299,999209 $300,000 to $399,999119 $400,000 to $499,999383 $500,000 to $749,999323 $750,000 to $999,999211 $1,000,000 to $1,499,9997 $1,500,000 to $1,999,999Rent paid by renters in 2022 in Spring Valley, NY 10 $150 to $199287 $200 to $24931 $250 to $299142 $300 to $34924 $350 to $399161 $450 to $499244 $500 to $54956 $550 to $59927 $600 to $649104 $650 to $699123 $700 to $74943 $750 to $799430 $800 to $899416 $900 to $999796 $1,000 to $1,2491,217 $1,250 to $1,4992,382 $1,500 to $1,999328 $2,000 to $2,499218 $2,500 to $2,99923 $3,000 to $3,49920 $3,500 or more250 No cash rent
Percentage of workers working in this county: 75.6%Number of people working at home: 1,049 (7.8% of all workers )
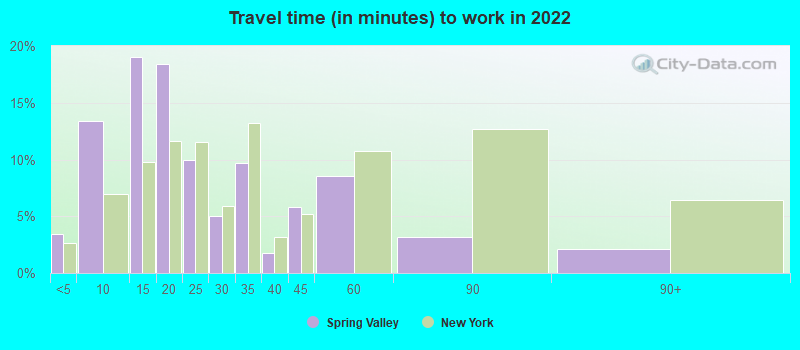
Travel time to work (commute)
Less than 5 minutes: 3015 to 9 minutes: 98210 to 14 minutes: 1,71615 to 19 minutes: 1,63420 to 24 minutes: 2,23825 to 29 minutes: 1,32430 to 34 minutes: 1,45635 to 39 minutes: 15640 to 44 minutes: 35645 to 59 minutes: 66060 to 89 minutes: 78290 or more minutes: 431
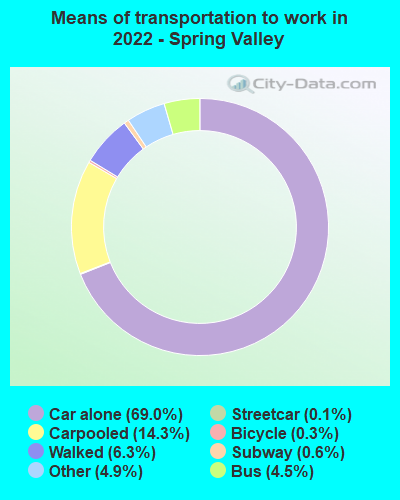
Means of transportation to work:
Drove a car alone: 5,597 (56.8%)Carpooled: 1,473 (15.0%)Bus : 377 (3.8%)Subway or elevated rail : 8 (0.1%)Long-distance train or commuter rail : 60 (0.6%)Light rail, streetcar or trolley : 7 (0.1%)Taxi: 541 (5.5%)Bicycle: 47 (0.5%)Walked: 653 (6.6%)Worked at home: 1,049 (10.7%)
Unemployment by race in 2022
Unemployment rate for White non-Hispanic residents 1.4% Males4.5% FemalesUnemployment rate for Black residents 8.4% Males7.8% FemalesUnemployment rate for Asian residents 30.2% Males1.4% FemalesUnemployment rate for other race residents 8.3% Males5.8% FemalesUnemployment rate for Hispanic or Latino residents 3.9% Males2.2% Females
Year of entry for the foreign-born population in Spring Valley, New York
4,895 2010 or later 2,976 2000 to 2009 1,523 1990 to 1999 3,128 1980 to 1989 1,043 1970 to 1979 593 Before 1970
First ancestries reported:
Haitian: 4,784 (25.9%)
American: 2,210 (12.0%)
Hungarian: 1,815 (9.8%)
Polish: 705 (3.8%)
European: 532 (2.9%)
Jamaican: 307 (1.7%)
Eastern European: 174 (0.9%)
Trinidadian and Tobagonian: 159 (0.9%)
Russian: 132 (0.7%)
Ukrainian: 105 (0.6%)
African: 97 (0.5%)
Israeli: 76 (0.4%)
Ghanaian: 75 (0.4%)
Estonian: 56 (0.3%)
English: 49 (0.3%)
Egyptian: 48 (0.3%)
German: 42 (0.2%)
Austrian: 37 (0.2%)
Romanian: 33 (0.2%)
Irish: 32 (0.2%)
French: 30 (0.2%)
Brazilian: 27 (0.1%)
Belizean: 26 (0.1%)
Italian: 22 (0.1%)
Dutch: 21 (0.1%)
West Indian: 21 (0.1%)
Nigerian: 18 (0.10%)
Norwegian: 16 (0.09%)
Slovak: 16 (0.09%)
Danish: 12 (0.06%)
Turkish: 10 (0.05%)
British West Indian: 10 (0.05%)
Lithuanian: 9 (0.05%)
French Canadian: 3 (0.02%) Most common places of birth for foreign-born residents (%): Haiti Spring Valley:
38.5% (4,533)New York:
2.8% (126,936)
Guatemala Spring Valley:
14.2% (1,669)New York:
1.4% (61,245)
Ecuador Spring Valley:
9.7% (1,140)New York:
3.9% (177,448)
Dominican Republic Spring Valley:
6.2% (727)New York:
11.1% (501,040)
Poland Spring Valley:
2.7% (317)New York:
1.4% (65,102)
India Spring Valley:
2.7% (312)New York:
3.5% (158,432)
Jamaica Spring Valley:
2.4% (281)New York:
5.0% (227,557)
Mexico Spring Valley:
2.1% (253)New York:
4.8% (214,559)
Canada Spring Valley:
1.7% (199)New York:
1.3% (59,107)
Other Eastern Europe Spring Valley:
1.5% (180)New York:
0.7% (30,173)
Place of birth for U.S.-born residents:
This state: 17,851Other state: 2,442Northeast: 1,547Midwest: 62South: 753West: 119 90.0% of Spring Valley residents lived in the same house 1 years ago.
Out of people who lived in different houses, 37.0% lived in this county.
Out of people who lived in different counties, 89.7% lived in New York.
Spring Valley:
90.0%State average:
89.6%
Education attainment for males 25 years and older:
No schooling: 707Nursery to 4th grade: 3575th and 6th grade: 2217th and 8th grade: 379th grade: 26610th grade: 4711th grade: 17012th grade, no diploma: 732High school graduate (or equivalency): 1,940Less than 1 year of college: 297Some college more than 1 year, no degree: 1,561Associate degree: 638Bachelor's degree: 1,281Master's degree: 314Professional school degree: 177Doctorate degree: 123
Education attainment for females 25 years and older:
No schooling: 1,205Nursery to 4th grade: 745th and 6th grade: 1577th and 8th grade: 719th grade: 4010th grade: 12511th grade: 5112th grade, no diploma: 715High school graduate (or equivalency): 2,563Less than 1 year of college: 587Some college more than 1 year, no degree: 1,260Associate degree: 644Bachelor's degree: 973Master's degree: 509Professional school degree: 58Doctorate degree: 0
Housing units in structures:
One, detached: 1,424One, attached: 691Two: 1,1813 or 4: 8565 to 9: 1,88410 to 19: 1,29420 to 49: 97450 or more: 1,934Housing units lacking complete plumbing facilities in 2022: 1.1%Housing units lacking complete kitchen facilities in 2022: 1.1%House/condo owner moved in on average 14 years ago
Renter moved in on average 7 years ago
Private vs. public school enrollment:
Students in private schools in grades 1 to 8 (elementary and middle school): 2,569 Students in private schools in grades 9 to 12 (high school): 1,241 Students in private undergraduate colleges: 1,124