Port Jervis, NY (New York) Houses and Residents
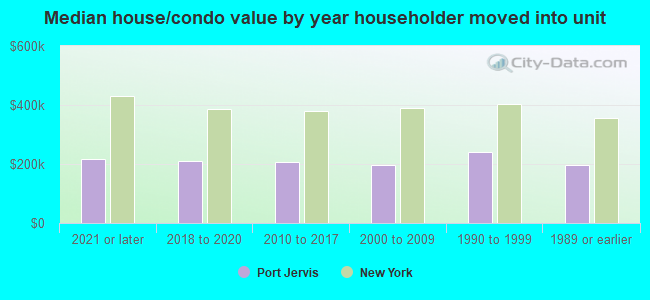
| Port Jervis: | $207,801 |
| New York: | $400,400 |
Total population: 8,638 (All urban)
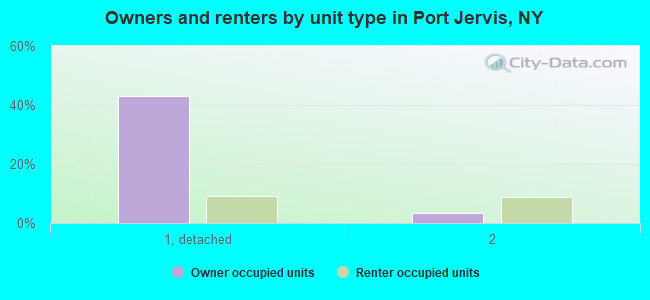
Houses: 3,965 (3,580 occupied: 1,806 owner occupied, 1,828 renter occupied)
| % of renters here: | 50% |
| State: | 46% |
Housing density: 1,564 houses/condos per square mile
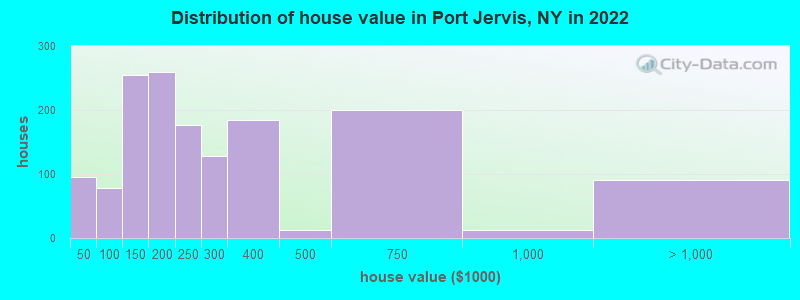
Median price asked for vacant for-sale houses and condos in 2022: $131,311.
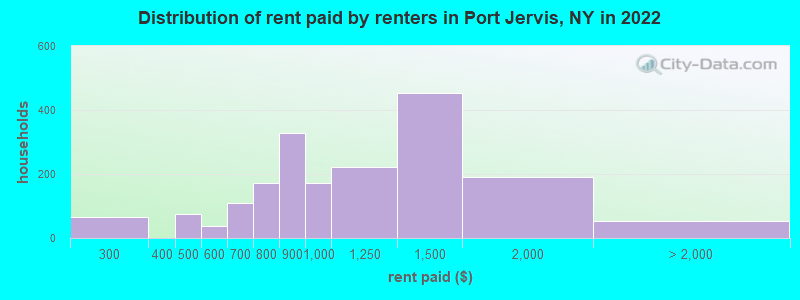
Median contract rent in 2022: $983 (lower quartile is $787, upper quartile is $1,325)
Median rent asked for vacant for-rent units in 2022: $2,585
Median gross rent in Port Jervis, NY in 2022: $1,211
Housing units in Port Jervis with a mortgage: 900 (67 second mortgage, 0 home equity loan, 69 both second mortgage and home equity loan)
Houses without a mortgage: 83
Median household income for houses/condos with a mortgage: $77,165
Median household income for apartments without a mortgage: $33,700
Median monthly housing costs: $1,167
Compare current foreclosures near Port Jervis, NY:
| Photo | Address | Area | Beds / Baths | Price | Details |
|---|---|---|---|---|---|

|
#1
Front St
Port Jervis, NY 12771
|
2,625 sq. feet
|
2 baths 6 beds |
$27,500
|
show details |

|
#2
Mullock Rd
Port Jervis, NY 12771
|
1,728 sq. feet
|
2 baths 3 beds |
show details | |

|
#3
Mechanic St
Port Jervis, NY 12771
|
1,710 sq. feet
|
2 baths 3 beds |
show details | |

|
#4
1st St
Port Jervis, NY 12771
|
1,408 sq. feet
|
1 baths 3 beds |
show details | |

|
#5
Greenville Tpke
Port Jervis, NY 12771
|
2,264 sq. feet
|
3 baths 4 beds |
show details | |

|
#6
County Route 1
Port Jervis, NY 12771
|
1,080 sq. feet
|
2 baths 2 beds |
show details | |

|
#7
Shin Hollow Rd
Port Jervis, NY 12771
|
1,836 sq. feet
|
2 baths 3 beds |
show details | |

|
#8
Black Rock Trl
Port Jervis, NY 12771
|
1,248 sq. feet
|
2 baths 3 beds |
show details | |

|
#9
Fort Van Tyle Rd
Port Jervis, NY 12771
|
1,680 sq. feet
|
2 baths 3 beds |
show details | |

|
#10
Trovei Ln
Port Jervis, NY 12771
|
2,848 sq. feet
|
2 baths 4 beds |
show details |
| Photo | Address | Area | Beds / Baths | Price | Details |
|---|---|---|---|---|---|

|
#11
Francis St
Port Jervis, NY 12771
|
1,232 sq. feet
|
1 baths 3 beds |
show details | |

|
#12
Greenville Tpke
Port Jervis, NY 12771
|
3,136 sq. feet
|
3 baths 2 beds |
show details | |

|
#13
Sussex St
Port Jervis, NY 12771
|
2,724 sq. feet
|
2 baths 4 beds |
show details | |

|
#14
Monahan Rd
Port Jervis, NY 12771
|
1,560 sq. feet
|
3 baths 4 beds |
show details | |

|
#15
Seward Ave
Port Jervis, NY 12771
|
2,028 sq. feet
|
2 baths 6 beds |
show details | |

|
#16
Lime Kiln Rd
Port Jervis, NY 12771
|
2,240 sq. feet
|
4 baths 3 beds |
show details | |

|
#17
Maiden Ln
Port Jervis, NY 12771
|
1,564 sq. feet
|
2 baths 3 beds |
show details | |

|
#18
Black Rock Trl
Port Jervis, NY 12771
|
1,144 sq. feet
|
1 baths 3 beds |
show details | |

|
#19
Walker Rd
Port Jervis, NY 12771
|
- sq. feet
|
1 baths 1 beds |
show details | |

|
#20
W Main St
Port Jervis, NY 12771
|
- sq. feet
|
- baths - beds |
show details |
| Photo | Address | Area | Beds / Baths | Price | Details |
|---|---|---|---|---|---|

|
#21
Elizabeth St
Port Jervis, NY 12771
|
- sq. feet
|
- baths - beds |
show details | |

|
#22
Route 209
Port Jervis, NY 12771
|
- sq. feet
|
- baths - beds |
show details | |

|
#23
Pike St Apt 23
Port Jervis, NY 12771
|
- sq. feet
|
- baths - beds |
show details | |

|
#24
Locust Rd
Sussex, NJ 07461
|
830 sq. feet
|
1 baths 3 beds |
$369,900
|
show details |

|
#25
Cliffside Ct
Hamburg, NJ 07419
|
1,739 sq. feet
|
2 baths 3 beds |
$450,000
|
show details |

|
#26
Cove Rd
Branchville, NJ 07826
|
1,863 sq. feet
|
1 baths 3 beds |
$439,900
|
show details |

|
#27
Phlox Ter
Glenwood, NJ 07418
|
2,448 sq. feet
|
2 baths 3 beds |
$356,900
|
show details |

|
#28
State St
Middletown, NY 10940
|
1,000 sq. feet
|
1 baths 3 beds |
$365,000
|
show details |

|
#29
Oak Ridge Dr
Milford, PA 18337
|
2,201 sq. feet
|
2 baths 4 beds |
$365,000
|
show details |

|
#30
Lake Shore Dr E
Rock Hill, NY 12775
|
2,820 sq. feet
|
3 baths 4 beds |
$439,900
|
show details |
| Photo | Address | Area | Beds / Baths | Price | Details |
|---|---|---|---|---|---|

|
#31
Beach Ln
Dingmans Ferry, PA 18328
|
- sq. feet
|
1 baths 3 beds |
$208,000
|
show details |

|
#32
Lower Rd
Westtown, NY 10998
|
2,560 sq. feet
|
3 baths 4 beds |
show details | |

|
#33
Watkins Ave
Middletown, NY 10940
|
1,136 sq. feet
|
1 baths 3 beds |
show details | |

|
#34
Route 211 W
Middletown, NY 10940
|
1,834 sq. feet
|
2 baths 5 beds |
show details | |

|
#35
Karen Joy Dr
Middletown, NY 10940
|
1,040 sq. feet
|
1 baths 3 beds |
show details | |

|
#36
Seybolt Ave
Otisville, NY 10963
|
996 sq. feet
|
2 baths 3 beds |
show details | |

|
#37
Carpathy Ct
Glen Spey, NY 12737
|
1,248 sq. feet
|
2 baths 3 beds |
show details | |

|
#38
Fieldstone Dr
Middletown, NY 10940
|
1,827 sq. feet
|
3 baths 3 beds |
show details | |

|
#39
Mt Orange Rd
Middletown, NY 10940
|
2,808 sq. feet
|
3 baths 4 beds |
show details | |

|
#40
Beattie Ave
Middletown, NY 10940
|
2,476 sq. feet
|
2 baths 5 beds |
show details |
| Photo | Address | Area | Beds / Baths | Price | Details |
|---|---|---|---|---|---|

|
#41
Wilson St
Middletown, NY 10940
|
1,170 sq. feet
|
1 baths 3 beds |
show details | |

|
#42
Darraugh Ln
Sparrow Bush, NY 12780
|
1,447 sq. feet
|
2 baths 4 beds |
show details | |

|
#43
S Centerville Rd
Middletown, NY 10940
|
2,000 sq. feet
|
3 baths 3 beds |
show details | |

|
#44
Pulaski Hwy
Pine Island, NY 10969
|
2,144 sq. feet
|
2 baths 4 beds |
show details | |

|
#45
Poplar Rd
Otisville, NY 10963
|
676 sq. feet
|
1 baths 2 beds |
show details | |

|
#46
S Plank Rd
Johnson, NY 10933
|
1,903 sq. feet
|
1 baths 3 beds |
show details | |

|
#47
Willow Ln
Glen Spey, NY 12737
|
2,236 sq. feet
|
3 baths 4 beds |
show details | |

|
#48
Forestburgh Rd
Glen Spey, NY 12737
|
1,905 sq. feet
|
2 baths 3 beds |
show details | |

|
#49
Hill St
Middletown, NY 10940
|
748 sq. feet
|
1 baths 2 beds |
show details | |

|
Check over 1 million property listings on Foreclosure.com!
|
browse all offers | |||


 | Where to live an 1-2 hrs from NYC? (110 replies) |
| smaller Upstate NY cities and towns/African American communities (6028 replies) |
| 6/2020 Would Buying a House in upstate NY be smart now? (20 replies) |
| Why don't we have a Hudson Valley forum? (70 replies) |
| NY Times: Extreme Commuting As A Personal Solution to Housing Challenges (104 replies) |
| Graduation videos… (38 replies) |

Median year apartment built: 1965
Household type by relationship:
Households: 8,827- Male householders: 1,539 (510 living alone), Female householders: 2,016 (908 living alone)
1,233 spouses (1,225 opposite-sex spouses), 248 unmarried partners, (227 opposite-sex unmarried partners), 2,830 children (2,586 natural, 78 adopted, 164 stepchildren), 303 grandchildren, 7 brothers or sisters, 26 parents, 2 foster children, 137 other relatives, 400 non-relatives
- In group quarters: 80
Size of family households: 729 2-persons, 510 3-persons, 273 4-persons, 260 5-persons, 101 6-persons, 68 7-or-more-persons.
Size of nonfamily households: 1,432 1-person, 179 2-persons, 17 3-persons, 39 5-persons, 7 6-persons.
908 married couples with children.
737 single-parent households (304 men, 433 women).
77.8% of residents of Port Jervis speak English at home.
9.8% of residents speak Spanish at home (60% speak English very well, 22% speak English well, 17% speak English not well, 1% don't speak English at all).
6.0% of residents speak other Indo-European language at home (34% speak English very well, 21% speak English well, 30% speak English not well, 15% don't speak English at all).
4.0% of residents speak Asian or Pacific Island language at home (34% speak English very well, 42% speak English well, 21% speak English not well, 4% don't speak English at all).
1.3% of residents speak other language at home (62% speak English very well, 38% speak English well).
Foreign born population: 1,089 (12.3%)
(43.3% of them are naturalized citizens)
| Here: | 6.4 |
| State: | 6.3 |
| Here: | 4.0 |
| State: | 3.8 |
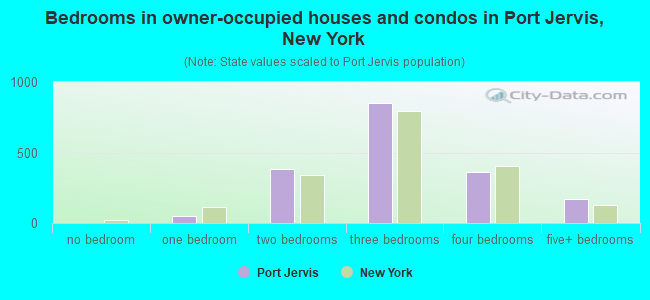
- Bedrooms in owner-occupied houses and condos in Port Jervis, New York
- 0no bedroom
- 511 bedroom
- 3802 bedrooms
- 8503 bedrooms
- 3594 bedrooms
- 1685+ bedrooms
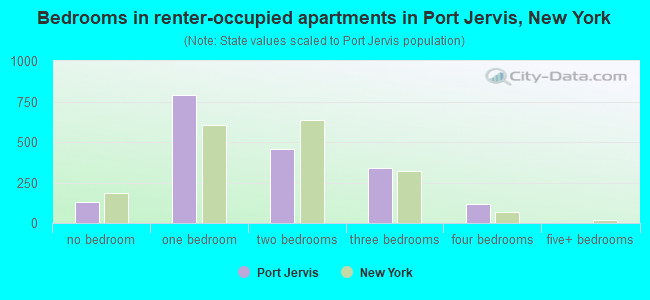
- Bedrooms in renter-occupied apartments in Port Jervis, New York
- 127no bedroom
- 7881 bedroom
- 4542 bedrooms
- 3413 bedrooms
- 1184 bedrooms
- 05+ bedrooms
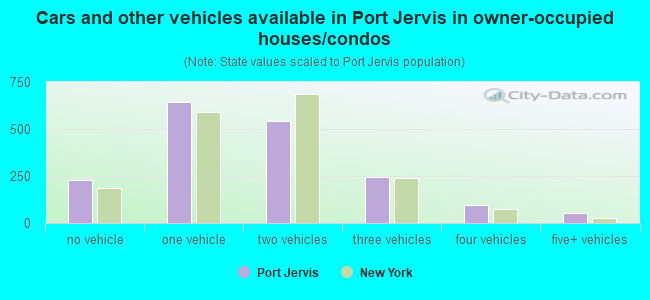
- Cars and other vehicles available in Port Jervis in owner-occupied houses/condos
- 229no vehicle
- 6431 vehicle
- 5402 vehicles
- 2463 vehicles
- 954 vehicles
- 545+ vehicles
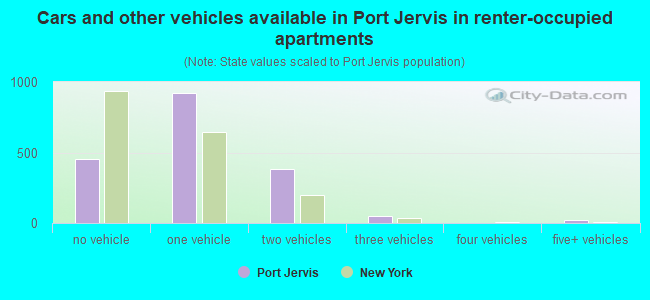
- Cars and other vehicles available in Port Jervis in renter-occupied apartments
- 455no vehicle
- 9201 vehicle
- 3852 vehicles
- 513 vehicles
- 04 vehicles
- 185+ vehicles
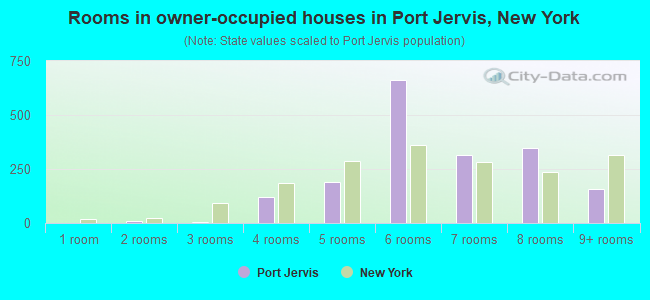
- Rooms in owner-occupied houses in Port Jervis, New York
- 01 room
- 112 rooms
- 53 rooms
- 1194 rooms
- 1905 rooms
- 6636 rooms
- 3147 rooms
- 3468 rooms
- 1579+ rooms
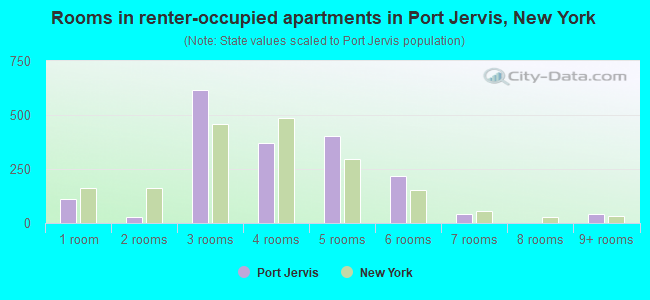
- Rooms in renter-occupied apartments in Port Jervis, New York
- 1111 room
- 272 rooms
- 6183 rooms
- 3704 rooms
- 4025 rooms
- 2176 rooms
- 427 rooms
- 08 rooms
- 409+ rooms
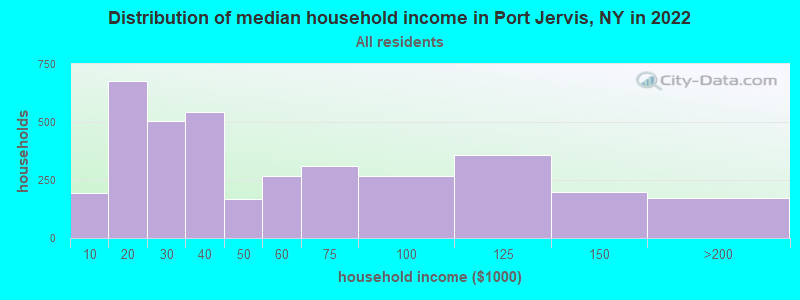
Port Jervis, NY household income distribution

- 194Less than $10,000
- 676$10,000 to $19,999
- 506$20,000 to $29,999
- 542$30,000 to $39,999
- 166$40,000 to $49,999
- 266$50,000 to $59,999
- 310$60,000 to $74,999
- 267$75,000 to $99,999
- 359$100,000 to $124,999
- 197$125,000 to $149,999
- 162$150,000 to $199,999
- 12$200,000 or more
Home value of owner - occupied houses in 2022 in Port Jervis, NY
-
- 89Less than $10,000
- 2$15,000 to $19,999
- 3$40,000 to $49,999
- 22$70,000 to $79,999
- 34$80,000 to $89,999
- 17$90,000 to $99,999
- 141$100,000 to $124,999
- 113$125,000 to $149,999
- 165$150,000 to $174,999
- 94$175,000 to $199,999
- 176$200,000 to $249,999
- 127$250,000 to $299,999
- 184$300,000 to $399,999
- 11$400,000 to $499,999
- 200$500,000 to $749,999
- 12$750,000 to $999,999
- 86$1,000,000 to $1,499,999
- 3$2,000,000 or more
Rent paid by renters in 2022 in Port Jervis, NY
-
- 42$200 to $249
- 22$250 to $299
- 64$400 to $449
- 10$450 to $499
- 6$500 to $549
- 31$550 to $599
- 30$600 to $649
- 77$650 to $699
- 124$700 to $749
- 47$750 to $799
- 327$800 to $899
- 172$900 to $999
- 221$1,000 to $1,249
- 454$1,250 to $1,499
- 190$1,500 to $1,999
- 51No cash rent
Percentage of workers working in this county: 73.8%
Number of people working at home: 159 (4.4% of all workers)
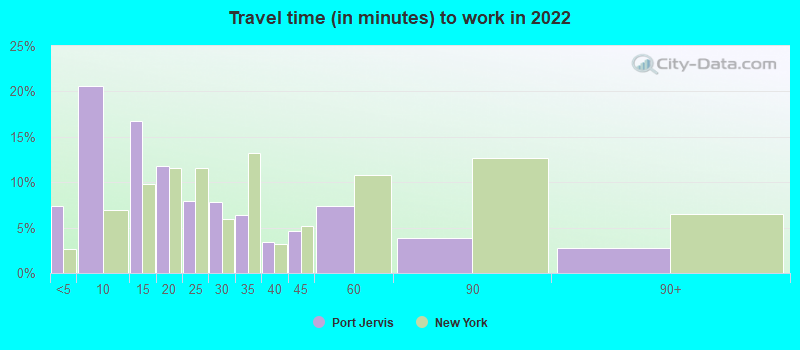
Travel time to work (commute)
- Less than 5 minutes: 538
- 5 to 9 minutes: 789
- 10 to 14 minutes: 448
- 15 to 19 minutes: 503
- 20 to 24 minutes: 74
- 25 to 29 minutes: 262
- 30 to 34 minutes: 105
- 35 to 39 minutes: 218
- 40 to 44 minutes: 121
- 45 to 59 minutes: 119
- 60 to 89 minutes: 123
- 90 or more minutes: 226
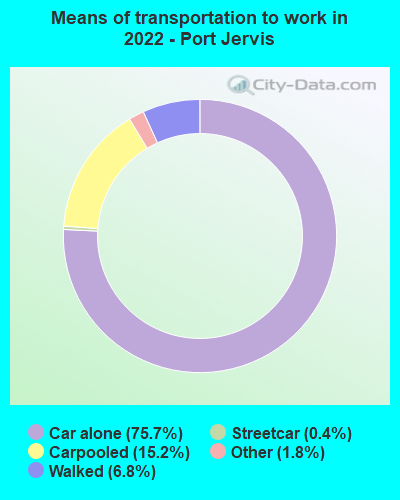
Means of transportation to work:
- Drove a car alone: 2,489 (68.6%)
- Carpooled: 625 (17.2%)
- Subway or elevated rail: 17 (0.5%)
- Taxi: 73 (2.0%)
- Walked: 251 (6.9%)
- Worked at home: 159 (4.4%)
- Unemployment by race in 2022
- Unemployment rate for White non-Hispanic residents
- 9.2%Males
- 7.2%Females
- Unemployment rate for Black residents
- 7.3%Males
- 15.2%Females
- Unemployment rate for Asian residents
- 7.3%Females
- Unemployment rate for other race residents
- 11.0%Males
- 4.9%Females
- Unemployment rate for Hispanic or Latino residents
- 3.0%Males
- 17.5%Females
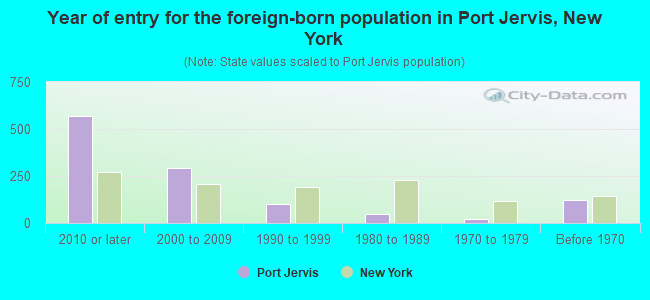
- Year of entry for the foreign-born population in Port Jervis, New York
- 5712010 or later
- 2922000 to 2009
- 1001990 to 1999
- 481980 to 1989
- 231970 to 1979
- 125Before 1970
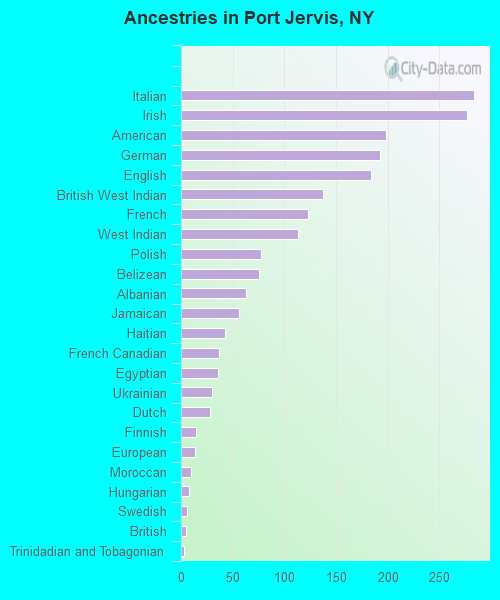
First ancestries reported:
- Italian: 284 (7.9%)
- Irish: 277 (7.7%)
- American: 198 (5.5%)
- German: 193 (5.3%)
- English: 184 (5.1%)
- British West Indian: 137 (3.8%)
- French: 123 (3.4%)
- West Indian: 113 (3.1%)
- Polish: 77 (2.1%)
- Belizean: 76 (2.1%)
- Albanian: 63 (1.7%)
- Jamaican: 56 (1.6%)
- Haitian: 43 (1.2%)
- French Canadian: 37 (1.0%)
- Egyptian: 36 (1.0%)
- Ukrainian: 30 (0.8%)
- Dutch: 28 (0.8%)
- Finnish: 15 (0.4%)
- European: 14 (0.4%)
- Moroccan: 10 (0.3%)
- Hungarian: 8 (0.2%)
- Swedish: 6 (0.2%)
- British: 5 (0.1%)
- Trinidadian and Tobagonian: 3 (0.08%)
Most common places of birth for foreign-born residents (%):
| Port Jervis: | 17.3% (171) |
| New York: | 0.4% (17,363) |
| Port Jervis: | 16.2% (160) |
| New York: | 9.1% (410,910) |
| Port Jervis: | 15.5% (153) |
| New York: | 3.5% (158,432) |
| Port Jervis: | 6.8% (67) |
| New York: | 1.2% (55,571) |
| Port Jervis: | 6.1% (60) |
| New York: | 5.0% (227,557) |
| Port Jervis: | 6.0% (59) |
| New York: | 0.2% (7,715) |
| Port Jervis: | 5.6% (55) |
| New York: | 2.5% (111,920) |
| Port Jervis: | 5.2% (51) |
| New York: | 0.4% (18,080) |
| Port Jervis: | 3.0% (30) |
| New York: | 0.6% (25,362) |
| Port Jervis: | 2.9% (29) |
| New York: | 0.9% (38,713) |
| Port Jervis: | 2.2% (22) |
| New York: | 4.8% (214,559) |
| Port Jervis: | 1.9% (19) |
| New York: | 2.0% (91,070) |
| Port Jervis: | 1.7% (17) |
| New York: | 0.3% (13,674) |
Place of birth for U.S.-born residents:
- This state: 5,997
- Other state: 1,427
- Northeast: 899
- Midwest: 103
- South: 381
- West: 43
86.5% of Port Jervis residents lived in the same house 1 years ago.
Out of people who lived in different houses, 29.6% lived in this county.
Out of people who lived in different counties, 72.5% lived in New York.
| Port Jervis: | 86.5% |
| State average: | 89.6% |
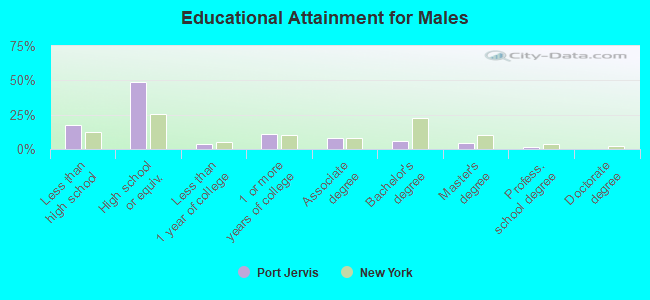
Education attainment for males 25 years and older:
- No schooling: 57
- Nursery to 4th grade: 7
- 5th and 6th grade: 23
- 7th and 8th grade: 55
- 9th grade: 260
- 10th grade: 35
- 11th grade: 40
- 12th grade, no diploma: 25
- High school graduate (or equivalency): 1,429
- Less than 1 year of college: 111
- Some college more than 1 year, no degree: 312
- Associate degree: 244
- Bachelor's degree: 162
- Master's degree: 128
- Professional school degree: 35
- Doctorate degree: 7
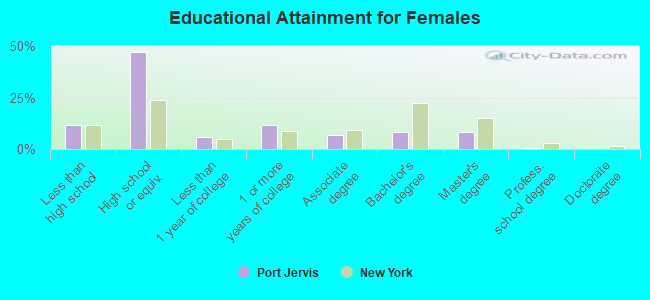
Education attainment for females 25 years and older:
- No schooling: 81
- Nursery to 4th grade: 1
- 5th and 6th grade: 7
- 7th and 8th grade: 88
- 9th grade: 64
- 10th grade: 34
- 11th grade: 63
- 12th grade, no diploma: 22
- High school graduate (or equivalency): 1,447
- Less than 1 year of college: 175
- Some college more than 1 year, no degree: 351
- Associate degree: 203
- Bachelor's degree: 260
- Master's degree: 260
- Professional school degree: 9
- Doctorate degree: 0


Housing units in structures:
- One, detached: 2,197
- One, attached: 62
- Two: 500
- 3 or 4: 369
- 5 to 9: 217
- 10 to 19: 49
- 20 to 49: 205
- 50 or more: 362
Housing units lacking complete kitchen facilities in 2022: 2.8%
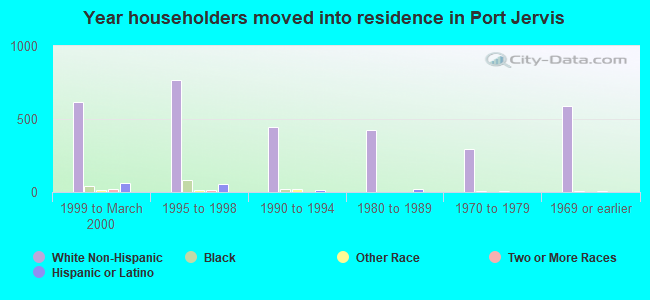
House/condo owner moved in on average 20 years ago
Renter moved in on average 3 years ago
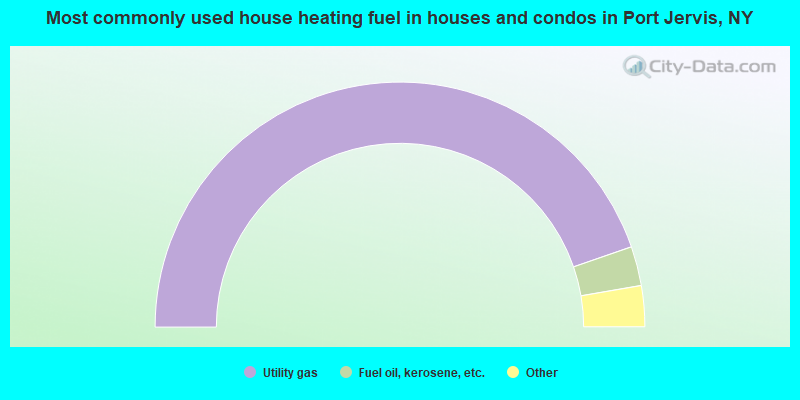
- 89.4%Utility gas
- 5.2%Fuel oil, kerosene, etc.
- 1.9%Bottled, tank, or LP gas
- 1.8%Electricity
- 1.7%Coal or coke
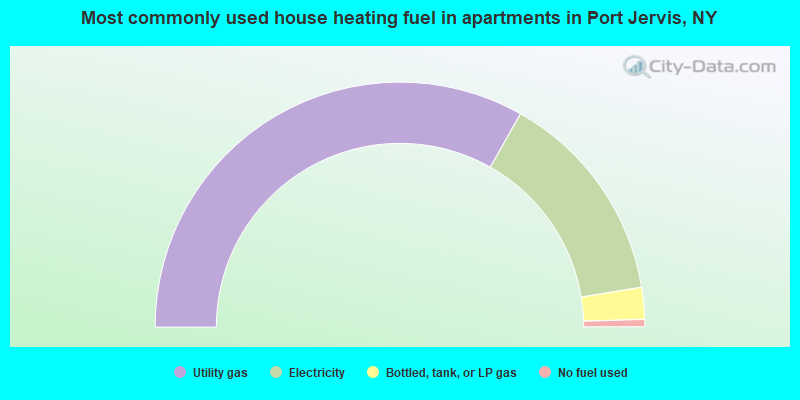
- 66.4%Utility gas
- 28.4%Electricity
- 4.2%Bottled, tank, or LP gas
- 1.0%No fuel used
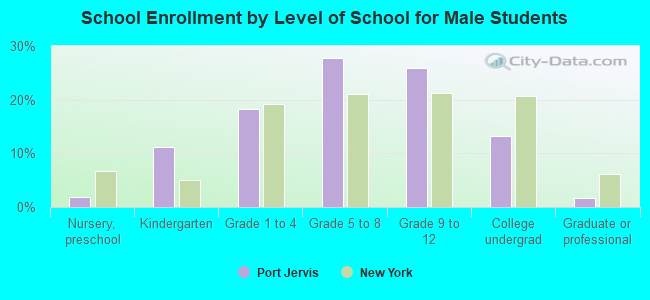
Private vs. public school enrollment:
| Here: | 7.6% |
| New York: | 15.6% |
| Here: | 17.8% |
| New York: | 15.0% |
| Here: | 19.8% |
| New York: | 39.2% |