Philmont, NY (New York) Houses and Residents
| Philmont: | $179,299 |
| New York: | $400,400 |
Mean price in 2022:
Detached houses: $190,385
Here: $190,385 State: $476,719 In 2-unit structures: $241,198
Here: $241,198 State: $713,077
Total population: 1,331 (Urban population: 0, Rural population: 1,476 (all nonfarm))
Houses: 705 (565 occupied: 333 owner occupied, 238 renter occupied)
| % of renters here: | 42% |
| State: | 46% |
Housing density: 599 houses/condos per square mile
Median price asked for vacant for-sale houses and condos in 2022 in this county: $421,244.
Median contract rent in 2022: $815
Median rent asked for vacant for-rent units in 2022: $3,673
Median gross rent in Philmont, NY in 2022: $916
Housing units in Philmont with a mortgage: 229 (38 second mortgage, 0 home equity loan, 38 both second mortgage and home equity loan)
Houses without a mortgage: 26
Median household income for houses/condos with a mortgage: $106,276
Median household income for apartments without a mortgage: $60,423
Median monthly housing costs: $962
Compare current foreclosures near Philmont, NY:
| Photo | Address | Area | Beds / Baths | Price | Details |
|---|---|---|---|---|---|

|
#1
Highland Ave
Philmont, NY 12565
|
1,768 sq. feet
|
2 baths 4 beds |
show details | |

|
#2
Summit St
Philmont, NY 12565
|
1,866 sq. feet
|
1 baths 3 beds |
show details | |

|
#3
Summit St
Philmont, NY 12565
|
1,769 sq. feet
|
1 baths 3 beds |
show details | |

|
#4
State Route 22
Copake Falls, NY 12517
|
1,200 sq. feet
|
1 baths 2 beds |
$445,000
|
show details |

|
#5
Summit St
Philmont, NY 12565
|
- sq. feet
|
- baths - beds |
show details | |

|
#6
Murphy Dr
Athens, NY 12015
|
2,340 sq. feet
|
3 baths 3 beds |
show details | |

|
#7
Laurel Mountain Rd
Spencertown, NY 12165
|
1,764 sq. feet
|
2 baths 3 beds |
show details | |

|
#8
Leeds Athens Rd
Athens, NY 12015
|
1,502 sq. feet
|
1 baths 3 beds |
show details | |

|
#9
Grandview Ave
Catskill, NY 12414
|
920 sq. feet
|
1 baths 2 beds |
show details | |

|
#10
County Route 10
Craryville, NY 12521
|
960 sq. feet
|
1 baths 2 beds |
show details |
| Photo | Address | Area | Beds / Baths | Price | Details |
|---|---|---|---|---|---|

|
#11
Andre Ct
Athens, NY 12015
|
1,155 sq. feet
|
1 baths 2 beds |
show details | |

|
#12
Howard Hall Rd # 5
Catskill, NY 12414
|
1,680 sq. feet
|
3 baths 3 beds |
show details | |

|
#13
Washington Ave
Coxsackie, NY 12051
|
1,510 sq. feet
|
1 baths 3 beds |
show details | |

|
#14
Mitchell Ave
Stuyvesant, NY 12173
|
2,788 sq. feet
|
2 baths 4 beds |
show details | |

|
#15
Route 9w
Athens, NY 12015
|
1,166 sq. feet
|
2 baths 3 beds |
show details | |

|
#16
River St
Valatie, NY 12184
|
1,540 sq. feet
|
2 baths 3 beds |
show details | |

|
#17
Maple Ave
Catskill, NY 12414
|
1,416 sq. feet
|
2 baths 5 beds |
show details | |

|
#18
Marion Blvd
Valatie, NY 12184
|
1,180 sq. feet
|
2 baths 3 beds |
show details | |

|
#19
Howell St
Catskill, NY 12414
|
1,520 sq. feet
|
1 baths 3 beds |
show details | |

|
#20
Roxbury Rd
Chatham, NY 12037
|
1,820 sq. feet
|
2 baths 4 beds |
show details |
| Photo | Address | Area | Beds / Baths | Price | Details |
|---|---|---|---|---|---|

|
#21
Clow Ln
Stuyvesant, NY 12173
|
1,832 sq. feet
|
1 baths 4 beds |
show details | |

|
#22
Snake Rd
Catskill, NY 12414
|
1,564 sq. feet
|
2 baths 3 beds |
show details | |

|
#23
W Bridge St
Catskill, NY 12414
|
1,488 sq. feet
|
1 baths 3 beds |
show details | |

|
#24
Orchard Rd
Elizaville, NY 12523
|
1,216 sq. feet
|
1 baths 2 beds |
show details | |

|
#25
Cauterskill Rd
Catskill, NY 12414
|
1,431 sq. feet
|
2 baths 3 beds |
show details | |

|
#26
Doodletown Rd
Ancram, NY 12502
|
1,812 sq. feet
|
1 baths 3 beds |
show details | |

|
#27
Miller Rd
Canaan, NY 12029
|
1,816 sq. feet
|
3 baths 3 beds |
show details | |

|
#28
Madison Ave West
New Baltimore, NY 12124
|
- sq. feet
|
1 baths 2 beds |
show details | |

|
#29
Cottontail Rd
Ancram, NY 12502
|
1,958 sq. feet
|
1 baths 2 beds |
show details | |

|
#30
Guy Ln
West Coxsackie, NY 12192
|
2,316 sq. feet
|
3 baths 3 beds |
show details |
| Photo | Address | Area | Beds / Baths | Price | Details |
|---|---|---|---|---|---|

|
#31
Ira Vail Rd
Leeds, NY 12451
|
887 sq. feet
|
1 baths 2 beds |
show details | |

|
#32
Old Walnut St
Catskill, NY 12414
|
1,536 sq. feet
|
2 baths 2 beds |
show details | |

|
#33
Route 23a, Catskill, Ny 12414
Catskill, NY 12414
|
1,152 sq. feet
|
1 baths 2 beds |
show details | |

|
#34
Sleepy Hollow Rd
Athens, NY 12015
|
1,728 sq. feet
|
2 baths 2 beds |
show details | |

|
#35
Home Rd
Great Barrington, MA 01230
|
1,725 sq. feet
|
3 baths 3 beds |
show details | |

|
#36
Fowler Lake Rd
Ghent, NY 12075
|
1,248 sq. feet
|
1 baths 1 beds |
show details | |

|
#37
Old Ln
Hudson, NY 12534
|
2,583 sq. feet
|
3 baths 4 beds |
show details | |

|
#38
State St
Hudson, NY 12534
|
2,614 sq. feet
|
3 baths 4 beds |
show details | |

|
#39
Tice Hill Rd
Ghent, NY 12075
|
3,058 sq. feet
|
3 baths 4 beds |
show details | |

|
#40
Union Tpke
Hudson, NY 12534
|
1,068 sq. feet
|
1 baths 2 beds |
show details |
| Photo | Address | Area | Beds / Baths | Price | Details |
|---|---|---|---|---|---|

|
#41
Schoolhouse Rd
Ghent, NY 12075
|
1,627 sq. feet
|
2 baths 3 beds |
show details | |

|
#42
Vosenkill Rd
Catskill, NY 12414
|
1,185 sq. feet
|
1 baths 2 beds |
show details | |

|
#43
Paul Ave
Hudson, NY 12534
|
1,132 sq. feet
|
1 baths 3 beds |
show details | |

|
#44
Vosenkill Rd
Catskill, NY 12414
|
1,278 sq. feet
|
1 baths 2 beds |
show details | |

|
#45
Main St
Catskill, NY 12414
|
1,262 sq. feet
|
1 baths 2 beds |
show details | |

|
#46
Route 203
Valatie, NY 12184
|
1,271 sq. feet
|
2 baths 3 beds |
show details | |

|
#47
W Main St
Catskill, NY 12414
|
2,538 sq. feet
|
2 baths 3 beds |
show details | |

|
#48
Howard Dr
West Coxsackie, NY 12192
|
1,064 sq. feet
|
1 baths 3 beds |
show details | |

|
#49
Sunrise Ln
Ghent, NY 12075
|
1,188 sq. feet
|
1 baths 3 beds |
show details | |

|
Check over 1 million property listings on Foreclosure.com!
|
browse all offers | |||

Latest news about housing in Philmont, NY collected exclusively by city-data.com from local newspapers, TV, and radio stations

 | Organic Homeschooling Sweet Family, leaving Hawaii to? (17 replies) |

Median year apartment built: 1954
Household type by relationship:
Households: 1,534- Male householders: 246 (109 living alone), Female householders: 304 (86 living alone)
238 spouses (238 opposite-sex spouses), 22 unmarried partners, (18 opposite-sex unmarried partners), 407 children (355 natural, 52 adopted, 0 stepchildren), 29 grandchildren, 0 brothers or sisters, 34 parents, 15 foster children, 24 other relatives, 125 non-relatives
- In group quarters: 85
Size of family households: 165 2-persons, 49 3-persons, 37 4-persons, 41 5-persons, 15 6-persons, 17 7-or-more-persons.
Size of nonfamily households: 209 1-person, 3 2-persons, 27 3-persons, 5 7-or-more-persons.
139 married couples with children.
104 single-parent households (0 men, 104 women).
95.1% of residents of Philmont speak English at home.
0.6% of residents speak Spanish at home (100% speak English very well).
0.1% of residents speak other Indo-European language at home (100% speak English very well).
4.4% of residents speak other language at home (100% speak English very well).
Foreign born population: 90 (5.9%)
(57.8% of them are naturalized citizens)
| Here: | 7.0 |
| State: | 6.3 |
| Here: | 4.2 |
| State: | 3.8 |

- Bedrooms in owner-occupied houses and condos in Philmont, New York
- 0no bedroom
- 151 bedroom
- 602 bedrooms
- 1453 bedrooms
- 824 bedrooms
- 315+ bedrooms

- Bedrooms in renter-occupied apartments in Philmont, New York
- 19no bedroom
- 381 bedroom
- 1132 bedrooms
- 263 bedrooms
- 424 bedrooms
- 05+ bedrooms

- Cars and other vehicles available in Philmont in owner-occupied houses/condos
- 0no vehicle
- 811 vehicle
- 1312 vehicles
- 743 vehicles
- 424 vehicles
- 65+ vehicles

- Cars and other vehicles available in Philmont in renter-occupied apartments
- 52no vehicle
- 1551 vehicle
- 312 vehicles
- 03 vehicles
- 04 vehicles
- 05+ vehicles

- Rooms in owner-occupied houses in Philmont, New York
- 01 room
- 02 rooms
- 153 rooms
- 214 rooms
- 65 rooms
- 846 rooms
- 727 rooms
- 678 rooms
- 679+ rooms

- Rooms in renter-occupied apartments in Philmont, New York
- 191 room
- 02 rooms
- 583 rooms
- 594 rooms
- 265 rooms
- 406 rooms
- 367 rooms
- 08 rooms
- 09+ rooms


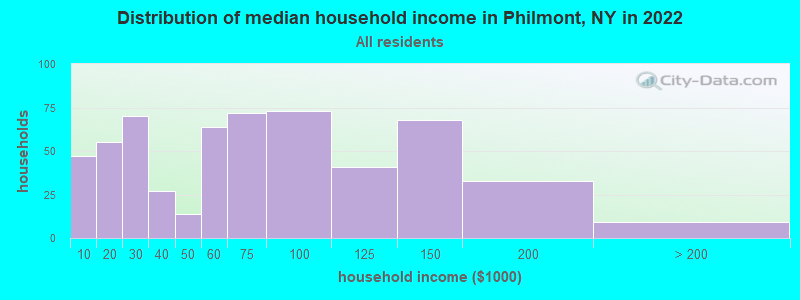
Philmont, NY household income distribution

- 47Less than $10,000
- 55$10,000 to $19,999
- 70$20,000 to $29,999
- 27$30,000 to $39,999
- 14$40,000 to $49,999
- 64$50,000 to $59,999
- 72$60,000 to $74,999
- 73$75,000 to $99,999
- 41$100,000 to $124,999
- 68$125,000 to $149,999
- 33$150,000 to $199,999
- 9$200,000 or more
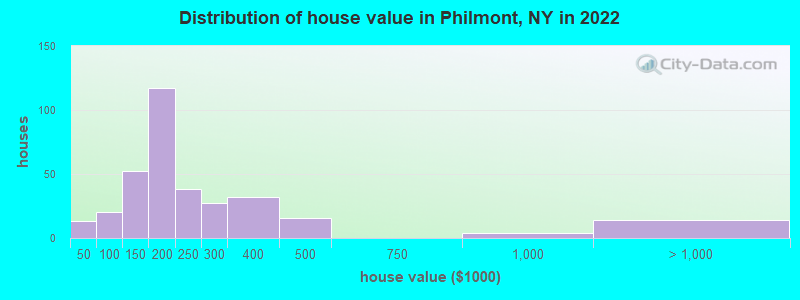
Home value of owner - occupied houses in 2022 in Philmont, NY
-
- 12$40,000 to $49,999
- 7$80,000 to $89,999
- 34$100,000 to $124,999
- 17$125,000 to $149,999
- 96$150,000 to $174,999
- 19$175,000 to $199,999
- 38$200,000 to $249,999
- 27$250,000 to $299,999
- 31$300,000 to $399,999
- 16$400,000 to $499,999
- 4$750,000 to $999,999
- 14$1,000,000 to $1,499,999
Rent paid by renters in 2022 in Philmont, NY
-
- 16$100 to $149
- 41$200 to $249
- 5$350 to $399
- 33$600 to $649
- 4$650 to $699
- 17$700 to $749
- 52$800 to $899
- 43$900 to $999
- 13$1,000 to $1,249
- 19$1,250 to $1,499


Percentage of workers working in this county: 78.1%
Number of people working at home: 52 (7.8% of all workers)
Travel time to work (commute)
- Less than 5 minutes: 0
- 5 to 9 minutes: 44
- 10 to 14 minutes: 139
- 15 to 19 minutes: 69
- 20 to 24 minutes: 212
- 25 to 29 minutes: 28
- 30 to 34 minutes: 0
- 35 to 39 minutes: 0
- 40 to 44 minutes: 12
- 45 to 59 minutes: 56
- 60 to 89 minutes: 40
- 90 or more minutes: 0
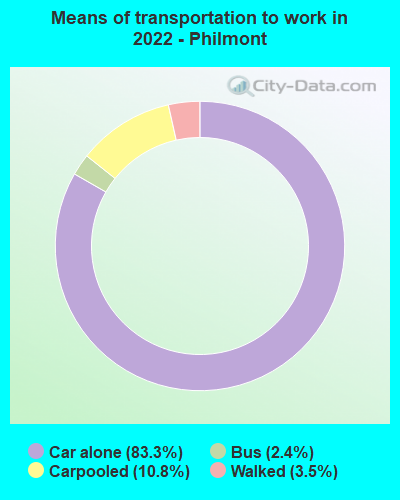
Means of transportation to work:
- Drove a car alone: 417 (73.5%)
- Carpooled: 48 (8.5%)
- Bus or trolley bus: 7 (1.2%)
- Walked: 15 (2.6%)
- Worked at home: 77 (13.6%)

- Unemployment by race in 2022
- Unemployment rate for White non-Hispanic residents
- 7.9%Males
- 9.5%Females

- Year of entry for the foreign-born population in Philmont, New York
- 02010 or later
- 652000 to 2009
- 201990 to 1999
- 151980 to 1989
- 41970 to 1979
- 13Before 1970

First ancestries reported:
- Irish: 66 (14.8%)
- Somali: 49 (11.0%)
- English: 40 (9.0%)
- Scotch-Irish: 31 (6.9%)
- Dutch: 16 (3.6%)
- German: 12 (2.7%)
- European: 11 (2.5%)
- American: 9 (2.0%)
- Scottish: 7 (1.6%)
- Polish: 6 (1.3%)
- Italian: 4 (0.9%)
Most common places of birth for foreign-born residents (%):
| Philmont: | 34.4% (31) |
| New York: | 0.1% (3,340) |
| Philmont: | 31.1% (28) |
| New York: | 0.1% (4,282) |
| Philmont: | 18.9% (17) |
| New York: | 0.5% (23,058) |
| Philmont: | 12.2% (11) |
| New York: | 0.7% (30,658) |
| Philmont: | 2.2% (2) |
| New York: | 1.3% (59,107) |
Place of birth for U.S.-born residents:
- This state: 1,043
- Other state: 379
- Northeast: 195
- Midwest: 36
- South: 54
- West: 97
90.6% of Philmont residents lived in the same house 1 years ago.
Out of people who lived in different houses, 7.3% lived in this county.
Out of people who lived in different counties, 100.0% lived in New York.
| Philmont: | 90.6% |
| State average: | 89.6% |
Education attainment for males 25 years and older:
- No schooling: 0
- Nursery to 4th grade: 0
- 5th and 6th grade: 0
- 7th and 8th grade: 2
- 9th grade: 27
- 10th grade: 4
- 11th grade: 0
- 12th grade, no diploma: 5
- High school graduate (or equivalency): 251
- Less than 1 year of college: 13
- Some college more than 1 year, no degree: 65
- Associate degree: 49
- Bachelor's degree: 126
- Master's degree: 81
- Professional school degree: 0
- Doctorate degree: 4

Education attainment for females 25 years and older:
- No schooling: 5
- Nursery to 4th grade: 0
- 5th and 6th grade: 0
- 7th and 8th grade: 0
- 9th grade: 0
- 10th grade: 0
- 11th grade: 0
- 12th grade, no diploma: 0
- High school graduate (or equivalency): 120
- Less than 1 year of college: 80
- Some college more than 1 year, no degree: 32
- Associate degree: 81
- Bachelor's degree: 82
- Master's degree: 29
- Professional school degree: 0
- Doctorate degree: 13


Housing units in structures:
- One, detached: 361
- One, attached: 24
- Two: 141
- 3 or 4: 82
- 5 to 9: 31
- 20 to 49: 50
- Mobile homes: 13
Housing units lacking complete kitchen facilities in 2022: 6.4%
House/condo owner moved in on average 15 years ago
Renter moved in on average 3 years ago

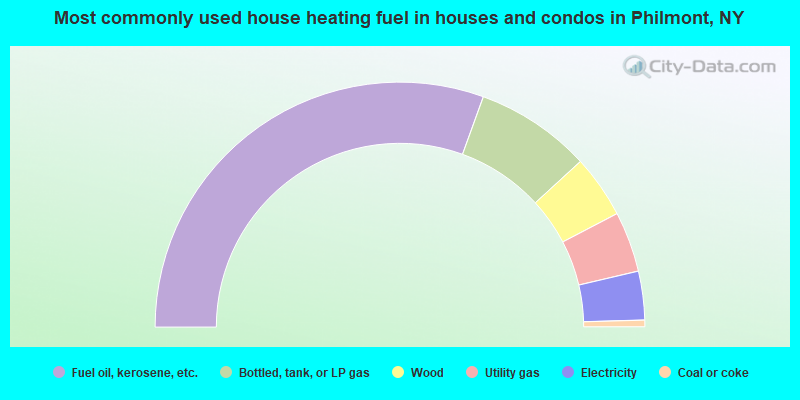
- 61.0%Fuel oil, kerosene, etc.
- 15.3%Bottled, tank, or LP gas
- 8.3%Wood
- 8.0%Utility gas
- 6.4%Electricity
- 0.9%Coal or coke
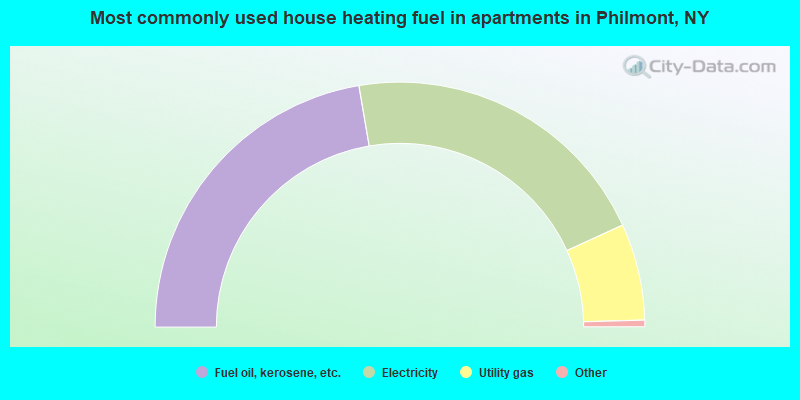
- 45.1%Fuel oil, kerosene, etc.
- 42.1%Electricity
- 12.9%Utility gas
Private vs. public school enrollment:
| Here: | 41.5% |
| New York: | 15.6% |
| Here: | 55.9% |
| New York: | 15.0% |
| Here: | 46.6% |
| New York: | 39.2% |


