Marbletown, NY (New York) Houses and Residents
| Marbletown: | $422,962 |
| New York: | $400,400 |
Total population: 5,607 (Urban population: 39, Rural population: 5,815 (all nonfarm))
Houses: 2,846 (2,386 occupied: 1,888 owner occupied, 498 renter occupied)
| % of renters here: | 21% |
| State: | 46% |
Housing density: 52 houses/condos per square mile
Median price asked for vacant for-sale houses and condos in 2022 in this county: $213,181.
Median contract rent in 2022: $1,217 (lower quartile is $807, upper quartile is $1,779)
Median rent asked for vacant for-rent units in 2022: $851
Median gross rent in Marbletown, NY in 2022: $1,644
Housing units in Marbletown with a mortgage: 999 (50 second mortgage, 181 home equity loan, 0 both second mortgage and home equity loan)
Houses without a mortgage: 465
Compare current foreclosures near Marbletown, NY:
| Photo | Address | Area | Beds / Baths | Price | Details |
|---|---|---|---|---|---|

|
#1
Cedar St
West Hurley, NY 12491
|
1,554 sq. feet
|
1 baths 4 beds |
$197,600
|
show details |

|
#2
Penny Ln
Marlboro, NY 12542
|
2,514 sq. feet
|
2 baths 3 beds |
$299,900
|
show details |

|
#3
Center Rd
High Falls, NY 12440
|
1,250 sq. feet
|
1 baths 2 beds |
$315,000
|
show details |

|
#4
Church St
Poughkeepsie, NY 12601
|
1,521 sq. feet
|
1 baths 4 beds |
$25,000
|
show details |

|
#5
James St
Rosendale, NY 12472
|
1,474 sq. feet
|
2 baths 4 beds |
$279,500
|
show details |

|
#6
Brunyswick
New Paltz, NY 12561
|
- sq. feet
|
1 baths 2 beds |
$104,900
|
show details |

|
#7
Route 9g
Hyde Park, NY 12538
|
2,142 sq. feet
|
2 baths 3 beds |
show details | |

|
#8
Alan St
Stone Ridge, NY 12484
|
2,110 sq. feet
|
2 baths 4 beds |
show details | |

|
#9
N Broadway
Kingston, NY 12401
|
1,376 sq. feet
|
2 baths 2 beds |
show details | |

|
#10
S Ohioville Rd
New Paltz, NY 12561
|
3,004 sq. feet
|
4 baths 4 beds |
show details |
| Photo | Address | Area | Beds / Baths | Price | Details |
|---|---|---|---|---|---|

|
#11
Shufeldt St
Kingston, NY 12401
|
1,561 sq. feet
|
1 baths 3 beds |
show details | |

|
#12
Browns Pond Rd
Staatsburg, NY 12580
|
3,944 sq. feet
|
5 baths 5 beds |
show details | |

|
#13
Hoar St
Ellenville, NY 12428
|
2,985 sq. feet
|
2 baths 5 beds |
show details | |

|
#14
Route 209
Kerhonkson, NY 12446
|
1,200 sq. feet
|
1 baths 3 beds |
show details | |

|
#15
Chapel St
Ellenville, NY 12428
|
869 sq. feet
|
1 baths 3 beds |
show details | |

|
#16
Ferris Ln
New Paltz, NY 12561
|
3,575 sq. feet
|
4 baths 4 beds |
show details | |

|
#17
S Main St
Ellenville, NY 12428
|
2,848 sq. feet
|
3 baths 4 beds |
show details | |

|
#18
Pine Echo Dr
Poughkeepsie, NY 12601
|
1,992 sq. feet
|
2 baths 3 beds |
show details | |

|
#19
Timber Ct
Highland, NY 12528
|
2,792 sq. feet
|
2 baths 3 beds |
show details | |

|
#20
Prospect St
Port Ewen, NY 12466
|
1,504 sq. feet
|
2 baths 4 beds |
show details |
| Photo | Address | Area | Beds / Baths | Price | Details |
|---|---|---|---|---|---|

|
#21
Elmendorf St
Kingston, NY 12401
|
2,219 sq. feet
|
2 baths 6 beds |
show details | |

|
#22
Nevins St
Ellenville, NY 12428
|
1,120 sq. feet
|
2 baths 3 beds |
show details | |

|
#23
Watch Hill Rd
New Paltz, NY 12561
|
1,729 sq. feet
|
2 baths 3 beds |
show details | |

|
#24
Clay Hill Rd
Kerhonkson, NY 12446
|
1,244 sq. feet
|
1 baths 2 beds |
show details | |

|
#25
N Elting Corners Rd
Highland, NY 12528
|
2,408 sq. feet
|
2 baths 4 beds |
show details | |

|
#26
Furnace St
Kingston, NY 12401
|
1,400 sq. feet
|
2 baths 4 beds |
show details | |

|
#27
S Clinton St
Poughkeepsie, NY 12601
|
3,732 sq. feet
|
2 baths 8 beds |
show details | |

|
#28
Highland Ave
Kerhonkson, NY 12446
|
1,012 sq. feet
|
1 baths 3 beds |
show details | |

|
#29
Harding Ave
Kingston, NY 12401
|
948 sq. feet
|
1 baths 2 beds |
show details | |

|
#30
1st Ave
Kingston, NY 12401
|
1,956 sq. feet
|
1 baths 3 beds |
show details |
| Photo | Address | Area | Beds / Baths | Price | Details |
|---|---|---|---|---|---|

|
#31
Waldorf Pl
Poughkeepsie, NY 12601
|
1,800 sq. feet
|
2 baths 3 beds |
show details | |

|
#32
Cardinal Rd
Hyde Park, NY 12538
|
2,692 sq. feet
|
2 baths 3 beds |
show details | |

|
#33
Maplewood Dr
Rhinebeck, NY 12572
|
2,063 sq. feet
|
2 baths 2 beds |
show details | |

|
#34
Vanessa Ln
Staatsburg, NY 12580
|
1,863 sq. feet
|
2 baths 4 beds |
show details | |

|
#35
Lisa Dr
Highland, NY 12528
|
2,002 sq. feet
|
3 baths 4 beds |
show details | |

|
#36
Rogers Pl
Hyde Park, NY 12538
|
1,404 sq. feet
|
1 baths 3 beds |
show details | |

|
#37
Meeker Rd
Wallkill, NY 12589
|
1,920 sq. feet
|
2 baths 3 beds |
show details | |

|
#38
Sand Hill Rd
Gardiner, NY 12525
|
1,788 sq. feet
|
2 baths 4 beds |
show details | |

|
#39
Witchtree Rd
Woodstock, NY 12498
|
1,628 sq. feet
|
2 baths 3 beds |
show details | |

|
#40
Carriage House Ct
Hyde Park, NY 12538
|
2,350 sq. feet
|
2 baths 4 beds |
show details |
| Photo | Address | Area | Beds / Baths | Price | Details |
|---|---|---|---|---|---|

|
#41
Haviland Rd
Poughkeepsie, NY 12601
|
1,800 sq. feet
|
1 baths 3 beds |
show details | |

|
#42
Route 9
Staatsburg, NY 12580
|
954 sq. feet
|
1 baths 2 beds |
show details | |

|
#43
Juniper Ln
Saugerties, NY 12477
|
- sq. feet
|
- baths - beds |
$39,900
|
show details |

|
#44
Harwich St
Kingston, NY 12401
|
1,866 sq. feet
|
2 baths 3 beds |
show details | |

|
#45
Dogwood St
Kingston, NY 12401
|
1,751 sq. feet
|
2 baths 4 beds |
show details | |

|
#46
Lawrence Rd
Hyde Park, NY 12538
|
2,200 sq. feet
|
3 baths 5 beds |
show details | |

|
#47
Holland Dr
West Hurley, NY 12491
|
1,334 sq. feet
|
2 baths 2 beds |
show details | |

|
#48
Roosevelt Rd
Hyde Park, NY 12538
|
1,566 sq. feet
|
2 baths 4 beds |
show details | |

|
#49
Richard Rd
Hyde Park, NY 12538
|
2,572 sq. feet
|
3 baths 3 beds |
show details | |

|
Check over 1 million property listings on Foreclosure.com!
|
browse all offers | |||
Latest news about housing in Marbletown, NY collected exclusively by city-data.com from local newspapers, TV, and radio stations

 | Adirondacks and Catskills- pricey? (6 replies) |
| Does Robert de Niro still live in TriBeCa? (25 replies) |
| I'm looking for a small rural town to live in, BROADLY in the Woodstock, NY area (could be MA or CT). (17 replies) |
| Ithaca vs New Paltz (15 replies) |
| Ulster County Schools (7 replies) |

Household type by relationship:
Households: 170,720- In family households: 136,249 (29,006 male householders, 15,373 female householders)
32,679 spouses, 46,411 children (43,288 natural, 1,072 adopted, 2,051 stepchildren), 2,688 grandchildren, 1,308 brothers or sisters, 1,585 parents, foster children, 1,522 other relatives, 4,657 non-relatives
- In nonfamily households: 34,471 (12,699 male householders (9,405 living alone)), 13,971 female householders (11,227 living alone)), 7,801 nonrelatives
- In group quarters: 11,773 (4,349 institutionalized population)
27,635 married couples with children.
9,974 single-parent households (2,588 men, 7,386 women).
94.1% of residents of Marbletown speak English at home.
2.3% of residents speak Spanish at home (100% speak English very well).
3.1% of residents speak other Indo-European language at home (91% speak English very well, 9% speak English well).
0.4% of residents speak Asian or Pacific Island language at home (100% speak English very well).
Foreign born population: 266 (4.4%)
(64.3% of them are naturalized citizens)
| Here: | 6.5 |
| State: | 6.3 |
| Here: | 3.9 |
| State: | 3.8 |

- Bedrooms in owner-occupied houses and condos in Marbletown, New York
- 11no bedroom
- 791 bedroom
- 3902 bedrooms
- 9543 bedrooms
- 4034 bedrooms
- 515+ bedrooms

- Bedrooms in renter-occupied apartments in Marbletown, New York
- 9no bedroom
- 1491 bedroom
- 2182 bedrooms
- 1063 bedrooms
- 164 bedrooms
- 05+ bedrooms

- Cars and other vehicles available in Marbletown in owner-occupied houses/condos
- 67no vehicle
- 6401 vehicle
- 7982 vehicles
- 2993 vehicles
- 734 vehicles
- 115+ vehicles

- Cars and other vehicles available in Marbletown in renter-occupied apartments
- 32no vehicle
- 1931 vehicle
- 2002 vehicles
- 663 vehicles
- 04 vehicles
- 75+ vehicles

- Rooms in owner-occupied houses in Marbletown, New York
- 111 room
- 02 rooms
- 493 rooms
- 1674 rooms
- 3825 rooms
- 3906 rooms
- 4137 rooms
- 2748 rooms
- 2029+ rooms

- Rooms in renter-occupied apartments in Marbletown, New York
- 91 room
- 572 rooms
- 893 rooms
- 1724 rooms
- 555 rooms
- 656 rooms
- 517 rooms
- 08 rooms
- 09+ rooms


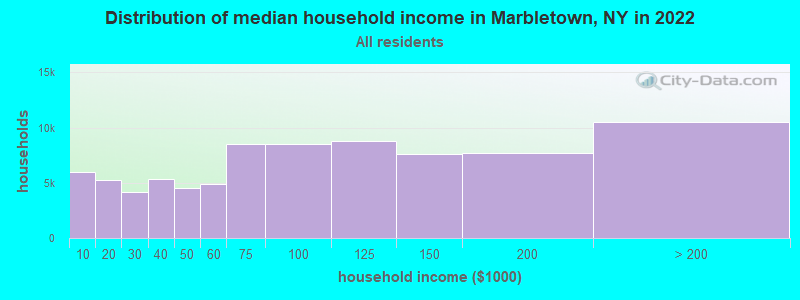
Marbletown, NY household income distribution

- 5,948Less than $10,000
- 5,242$10,000 to $19,999
- 4,141$20,000 to $29,999
- 5,317$30,000 to $39,999
- 4,566$40,000 to $49,999
- 4,916$50,000 to $59,999
- 8,555$60,000 to $74,999
- 8,486$75,000 to $99,999
- 8,745$100,000 to $124,999
- 7,625$125,000 to $149,999
- 7,679$150,000 to $199,999
- 10,504$200,000 or more
Percentage of workers working in this county: 83.1%
Number of people working at home: 516 (18.3% of all workers)
Travel time to work (commute)
- Less than 5 minutes: 80
- 5 to 9 minutes: 289
- 10 to 14 minutes: 231
- 15 to 19 minutes: 390
- 20 to 24 minutes: 391
- 25 to 29 minutes: 160
- 30 to 34 minutes: 395
- 35 to 39 minutes: 51
- 40 to 44 minutes: 63
- 45 to 59 minutes: 314
- 60 to 89 minutes: 112
- 90 or more minutes: 104
Means of transportation to work:
- Drove a car alone: 2,178 (77.6%)
- Carpooled: 265 (9.4%)
- Subway or elevated: 26 (0.9%)
- Walked: 79 (2.8%)
- Other means: 32 (1.1%)
- Worked at home: 226 (8.1%)


- Year of entry for the foreign-born population in Marbletown, New York
- 81995 to March 2000
- 01990 to 1994
- 111985 to 1989
- 221980 to 1984
- 01975 to 1979
- 81970 to 1974
- 01965 to 1969
- 120Before 1965

First ancestries reported:
- German: 1,503 (20.1%)
- Irish: 1,169 (15.6%)
- Italian: 1,088 (14.6%)
- English: 894 (12.0%)
- Other: 798 (10.7%)
- Dutch: 462 (6.2%)
- Polish: 230 (3.1%)
- United States: 181 (2.4%)
- French: 178 (2.4%)
- Scotch-Irish: 168 (2.2%)
- Russian: 149 (2.0%)
- Scottish: 136 (1.8%)
- Swedish: 110 (1.5%)
- Ukrainian: 85 (1.1%)
- French Canadian: 78 (1.0%)
- Welsh: 68 (0.9%)
- Norwegian: 48 (0.6%)
- Greek: 36 (0.5%)
- Hungarian: 25 (0.3%)
- Slovak: 22 (0.3%)
- Subsaharan African: 12 (0.2%)
- Danish: 11 (0.1%)
- West Indian: 10 (0.1%)
- Portuguese: 9 (0.1%)
- Czech: 7 (0.09%)
Most common places of birth for foreign-born residents (%):
| Marbletown: | 18.3% (31) |
| New York: | 1.6% (62,237) |
| Marbletown: | 16.6% (28) |
| New York: | 1.8% (69,327) |
| Marbletown: | 14.2% (24) |
| New York: | 0.3% (11,299) |
| Marbletown: | 12.4% (21) |
| New York: | 0.6% (25,059) |
| Marbletown: | 7.1% (12) |
| New York: | 3.8% (147,729) |
| Marbletown: | 7.1% (12) |
| New York: | 0.3% (13,246) |
| Marbletown: | 7.1% (12) |
| New York: | 1.4% (54,876) |
| Marbletown: | 6.5% (11) |
| New York: | 10.5% (408,086) |
| Marbletown: | 5.9% (10) |
| New York: | 0.3% (13,070) |
| Marbletown: | 4.7% (8) |
| New York: | 0.8% (32,034) |
Place of birth for U.S.-born residents:
- This state: 4,631
- Other state: 978
- Northeast: 421
- Midwest: 201
- South: 248
- West: 108
69% of Marbletown residents lived in the same house 5 years ago.
Out of people who lived in different houses, 57% lived in this county.
Out of people who lived in different counties, 52% lived in New York.
Education attainment for males 25 years and older:
- No schooling: 10
- Nursery to 4th grade: 0
- 5th and 6th grade: 9
- 7th and 8th grade: 30
- 9th grade: 11
- 10th grade: 70
- 11th grade: 26
- 12th grade, no diploma: 71
- High school graduate (or equivalency): 460
- Less than 1 year of college: 131
- Some college more than 1 year, no degree: 338
- Associate degree: 202
- Bachelor's degree: 434
- Master's degree: 193
- Professional school degree: 57
- Doctorate degree: 30

Education attainment for females 25 years and older:
- No schooling: 10
- Nursery to 4th grade: 0
- 5th and 6th grade: 12
- 7th and 8th grade: 23
- 9th grade: 15
- 10th grade: 0
- 11th grade: 86
- 12th grade, no diploma: 76
- High school graduate (or equivalency): 466
- Less than 1 year of college: 170
- Some college more than 1 year, no degree: 308
- Associate degree: 142
- Bachelor's degree: 422
- Master's degree: 343
- Professional school degree: 22
- Doctorate degree: 43


Housing units in structures:
- One, detached: 2,487
- One, attached: 8
- Two: 94
- 3 or 4: 102
- 5 to 9: 16
- 20 to 49: 9
- Mobile homes: 122
- Boats, RVs, vans, etc.: 8
Median worth of mobile homes: $101,081
Housing units lacking complete kitchen facilities: 1.0%

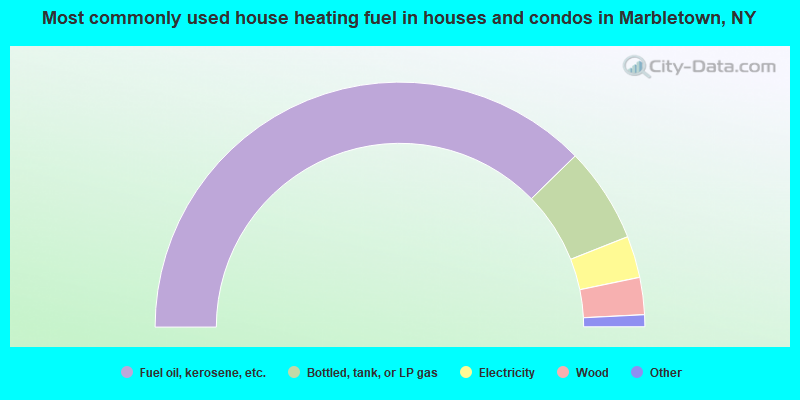
- 75.4%Fuel oil, kerosene, etc.
- 12.6%Bottled, tank, or LP gas
- 5.5%Electricity
- 4.9%Wood
- 1.2%Coal or coke
- 0.5%Utility gas
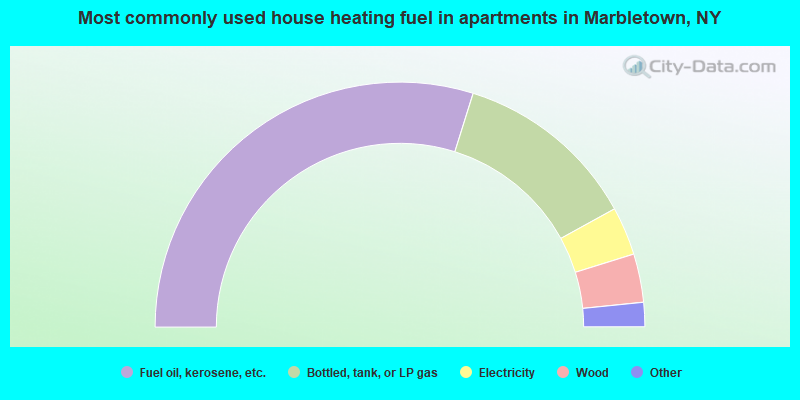
- 59.6%Fuel oil, kerosene, etc.
- 24.3%Bottled, tank, or LP gas
- 6.4%Electricity
- 6.4%Wood
- 1.6%Utility gas
- 1.6%Other fuel
Private vs. public school enrollment:
| Here: | 5.9% |
| New York: | 14.0% |
| Here: | 13.2% |
| New York: | 13.2% |
| Here: | 17.4% |
| New York: | 38.2% |


