Housing density: 1,318 houses/condos per square mile
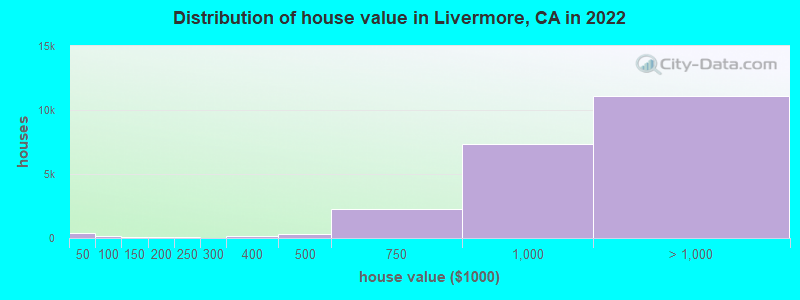
Median price asked for vacant for-sale houses and condos in 2022: $949,421.
Median contract rent in 2022: over $2,000 (lower quartile is $1,479, upper quartile is over $2,000)
Median rent asked for vacant for-rent units in 2022: $3,057
Median gross rent in Livermore, CA in 2022: over $2,000
Housing units in Livermore with a mortgage: 17,887 (1,678 second mortgage, 96 home equity loan, 1,264 both second mortgage and home equity loan) Houses without a mortgage: 0
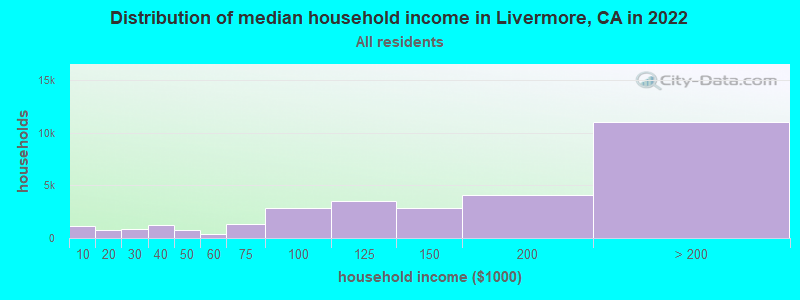
Median household income for houses/condos with a mortgage: $199,110
Median household income for apartments without a mortgage: $136,316
Size of family households: 9,321 2-persons, 4,813 3-persons, 5,851 4-persons, 2,074 5-persons, 315 6-persons, 207 7-or-more-persons.
Size of nonfamily households: 5,677 1-person, 2,451 2-persons, 98 3-persons.
15,118 married couples with children.
2,487 single-parent households (763 men, 1,724 women).
75.2% of residents of Livermore speak English at home.
11.2% of residents speak Spanish at home (46% speak English very well, 24% speak English well, 19% speak English not well, 11% don't speak English at all).
6.2% of residents speak other Indo-European language at home (81% speak English very well, 14% speak English well, 4% speak English not well, 1% don't speak English at all).
7.4% of residents speak Asian or Pacific Island language at home (66% speak English very well, 24% speak English well, 7% speak English not well, 2% don't speak English at all).
0.6% of residents speak other language at home (88% speak English very well, 11% speak English well, 1% don't speak English at all).
Foreign born population: 18,489 (21.8%)
(51.4% of them are naturalized citizens)
Percentage of workers working in this county: 79.4% Number of people working at home: 11,405 (24.7% of all workers)
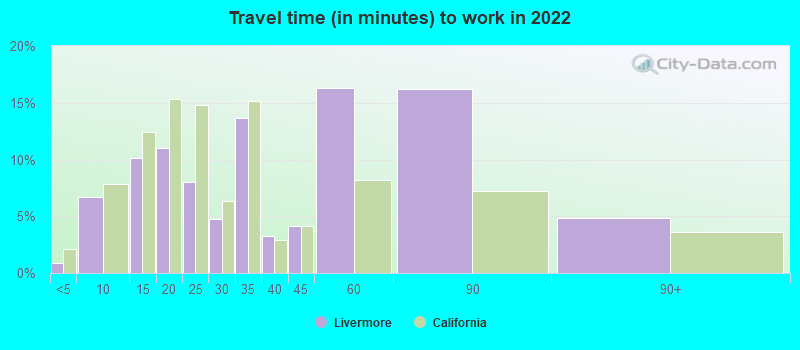
Travel time to work (commute)
Less than 5 minutes: 335
5 to 9 minutes: 3,670
10 to 14 minutes: 4,710
15 to 19 minutes: 5,093
20 to 24 minutes: 3,256
25 to 29 minutes: 1,051
30 to 34 minutes: 2,383
35 to 39 minutes: 544
40 to 44 minutes: 1,973
45 to 59 minutes: 4,047
60 to 89 minutes: 3,230
90 or more minutes: 1,544
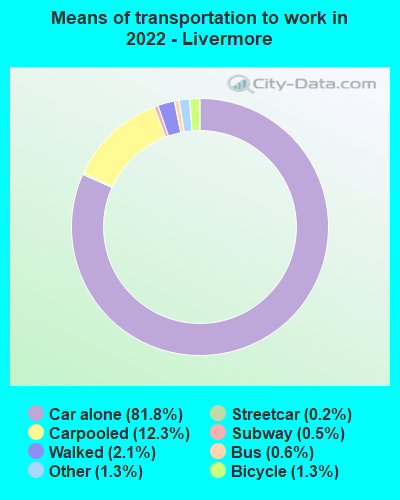
Means of transportation to work:
Drove a car alone: 36,420 (63.7%)
Carpooled: 5,753 (10.1%)
Bus: 220 (0.4%)
Subway or elevated rail: 81 (0.1%)
Long-distance train or commuter rail: 166 (0.3%)
Light rail, streetcar or trolley: 7 (0.0%)
Taxi: 609 (1.1%)
Bicycle: 618 (1.1%)
Walked: 926 (1.6%)
Worked at home: 11,405 (20.0%)
Unemployment by race in 2022
Unemployment rate for White non-Hispanic residents
1.7%Males
0.9%Females
Unemployment rate for Black residents
9.8%Males
10.8%Females
Unemployment rate for American Indian and Alaska Native residents
8.5%Males
5.2%Females
Unemployment rate for Asian residents
6.6%Males
1.0%Females
Unemployment rate for other race residents
3.7%Males
1.9%Females
Unemployment rate for two or more race residents
5.6%Males
2.3%Females
Unemployment rate for Hispanic or Latino residents
4.4%Males
2.1%Females
Year of entry for the foreign-born population in Livermore, California
4,7462010 or later
5,0532000 to 2009
2,8871990 to 1999
2,3691980 to 1989
1,0261970 to 1979
1,659Before 1970
First ancestries reported:
English: 2,484 (6.1%)
Irish: 1,664 (4.1%)
German: 1,647 (4.0%)
European: 1,644 (4.0%)
American: 1,536 (3.8%)
Italian: 1,388 (3.4%)
Polish: 462 (1.1%)
Portuguese: 396 (1.0%)
Norwegian: 367 (0.9%)
French: 354 (0.9%)
Swedish: 350 (0.9%)
Iranian: 300 (0.7%)
British: 258 (0.6%)
Dutch: 237 (0.6%)
Scottish: 237 (0.6%)
Russian: 208 (0.5%)
Scotch-Irish: 189 (0.5%)
Romanian: 177 (0.4%)
Austrian: 162 (0.4%)
Northern European: 154 (0.4%)
French Canadian: 123 (0.3%)
Greek: 117 (0.3%)
Nigerian: 112 (0.3%)
Scandinavian: 109 (0.3%)
Ukrainian: 108 (0.3%)
Eastern European: 107 (0.3%)
Egyptian: 95 (0.2%)
Danish: 95 (0.2%)
Finnish: 75 (0.2%)
Canadian: 75 (0.2%)
Turkish: 70 (0.2%)
Israeli: 62 (0.2%)
Croatian: 53 (0.1%)
Welsh: 45 (0.1%)
Swiss: 42 (0.1%)
Cape Verdean: 41 (0.1%)
Serbian: 32 (0.08%)
Celtic: 26 (0.06%)
Lithuanian: 26 (0.06%)
Brazilian: 21 (0.05%)
Ethiopian: 20 (0.05%)
Afghan: 20 (0.05%)
Jamaican: 20 (0.05%)
Basque: 20 (0.05%)
Bulgarian: 19 (0.05%)
Arab: 18 (0.04%)
African: 17 (0.04%)
Belgian: 16 (0.04%)
Pennsylvania German: 14 (0.03%)
Czech: 14 (0.03%)
Armenian: 14 (0.03%)
South African: 14 (0.03%)
Lebanese: 13 (0.03%)
Slovak: 12 (0.03%)
Luxembourger: 12 (0.03%)
Czechoslovakian: 10 (0.02%)
Slovene: 3 (0.01%)
Most common places of birth for foreign-born residents (%):
India
Livermore:
23.0% (3,848)
California:
5.2% (539,184)
Mexico
Livermore:
21.8% (3,650)
California:
37.2% (3,881,193)
Philippines
Livermore:
8.4% (1,400)
California:
7.8% (818,297)
China, excluding Hong Kong and Taiwan
Livermore:
4.7% (783)
California:
6.6% (684,672)
Korea
Livermore:
3.1% (520)
California:
3.0% (315,248)
England
Livermore:
2.7% (447)
California:
0.6% (57,953)
Canada
Livermore:
2.4% (400)
California:
1.2% (127,477)
Vietnam
Livermore:
2.3% (393)
California:
4.9% (512,335)
Iran
Livermore:
1.8% (304)
California:
2.0% (206,004)
Peru
Livermore:
1.7% (292)
California:
0.7% (74,025)
Pakistan
Livermore:
1.7% (284)
California:
0.5% (49,399)
France
Livermore:
1.5% (257)
California:
0.4% (40,224)
Place of birth for U.S.-born residents:
This state: 50,075
Other state: 15,458
Northeast: 3,189
Midwest: 4,029
South: 4,387
West: 3,853
88.1% of Livermore residents lived in the same house 1 years ago. Out of people who lived in different houses, 37.2% lived in this county. Out of people who lived in different counties, 73.8% lived in California.
Livermore:
88.1%
State average:
88.9%
Education attainment for males 25 years and older:
No schooling: 1,398
Nursery to 4th grade: 0
5th and 6th grade: 0
7th and 8th grade: 0
9th grade: 65
10th grade: 0
11th grade: 0
12th grade, no diploma: 346
High school graduate (or equivalency): 4,393
Less than 1 year of college: 1,830
Some college more than 1 year, no degree: 3,271
Associate degree: 2,047
Bachelor's degree: 9,346
Master's degree: 4,630
Professional school degree: 1,061
Doctorate degree: 1,508
Education attainment for females 25 years and older:
No schooling: 1,132
Nursery to 4th grade: 182
5th and 6th grade: 270
7th and 8th grade: 0
9th grade: 0
10th grade: 0
11th grade: 61
12th grade, no diploma: 323
High school graduate (or equivalency): 3,937
Less than 1 year of college: 2,003
Some college more than 1 year, no degree: 3,482
Associate degree: 2,926
Bachelor's degree: 10,926
Master's degree: 4,242
Professional school degree: 749
Doctorate degree: 873
Housing units in structures:
One, detached: 22,470
One, attached: 3,835
Two: 381
3 or 4: 731
5 to 9: 509
10 to 19: 1,073
20 to 49: 504
50 or more: 1,590
Mobile homes: 448
Median worth of mobile homes: $163,000
Housing units lacking complete kitchen facilities in 2022: 0.7%
House/condo owner moved in on average 10 years ago