Lebanon, TN (Tennessee) Houses and Residents
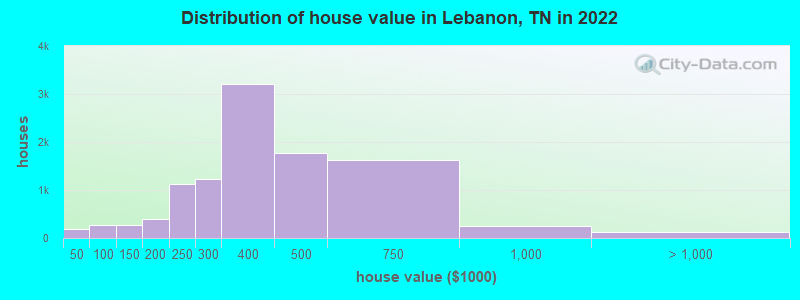
Estimated median house or condo value in 2022: $396,516 (it was $113,700 in 2000 )
Lebanon:
$396,516Tennessee:
$284,800
Lower value quartile - upper value quartile: $293,486 - $559,603Total population: 29,427 (Urban population: 19,203 (all inside urban clusters), Rural population: 1,095 (19 farm, 1,076 nonfarm ))
Houses: 16,884 (16,089 occupied: 9,834 owner occupied, 6,748 renter occupied )
% of renters here:
41%State:
33%
Housing density: 577 houses/condos per square mile
Median price asked for vacant for-sale houses and condos in 2022: $126,743.
Median contract rent in 2022: $1,049 (lower quartile is $793, upper quartile is $1,351)
Median rent asked for vacant for-rent units in 2022: $1,071
Median gross rent in Lebanon, TN in 2022: $1,229
Housing units in Lebanon with a mortgage: 6,706 (583 second mortgage, 9 home equity loan, 443 both second mortgage and home equity loan )Houses without a mortgage: 202
Median household income for houses/condos with a mortgage: $99,422
Median household income for apartments without a mortgage: $69,711
Median monthly housing costs: $1,294
Data:
Median house or condo value ($)
Median house or condo value ($ change since 2000)
Median house or condo value ($) - White
Median house or condo value ($) - Black or African American
Median house or condo value ($) - Asian
Median house or condo value ($) - Hispanic or Latino
Median house or condo value ($) - American Indian and Alaska Native
Median house or condo value ($) - Multirace
Median house or condo value ($) - Other Race
Median price asked for mobile homes ($)
Household density (households per square mile)
Mean house or condo value by units in structure - 1, detached ($)
Mean house or condo value by units in structure - 1, attached ($)
Mean house or condo value by units in structure - 2 ($)
Mean house or condo value by units in structure by units in structure - 3 or 4 ($)
Mean house or condo value by units in structure - 5 or more ($)
Mean house or condo value by units in structure - Boat, RV, van, etc. ($)
Mean house or condo value by units in structure - Mobile home ($)
Median contract rent ($)
Median contract rent - Lower quartile ($)
Median contract rent - Upper quartile ($)
Median gross rent ($)
Urban houses (%)
Rural houses (%)
Houses occupied (%)
Houses occupied (% change since 2000)
Houses owner occupied (%)
Houses owner occupied (% change since 2000)
Houses renter occupied (%)
Houses renter occupied (% change since 2000)
Vacant housing units - For rent (%)
Vacant housing units - For rent (% change since 2000)
Vacant housing units - For sale only (%)
Vacant housing units - For sale only (% change since 2000)
Vacant housing units - Rented or sold, not occupied (%)
Vacant housing units - Rented or sold, not occupied (% change since 2000)
Vacant housing units - For seasonal, recreational, or occasional use (%)
Vacant housing units - For seasonal, recreational, or occasional use (% change since 2000)
Vacant housing units - For migrant workers (%)
Vacant housing units - For migrant workers (% change since 2000)
Vacant housing units - Other vacant (%)
Vacant housing units - Other vacant (% change since 2000)
Median monthly housing costs ($)
Median household income for houses/condos with a mortgage ($)
Median household income for houses/condos without a mortgage ($)
Median household income ($)
Median household income ($) - White
Median household income ($) - Black or African American
Median household income ($) - Asian
Median household income ($) - Hispanic or Latino
Median household income ($) - American Indian and Alaska Native
Median household income ($) - Multirace
Median household income ($) - Other Race
Mortgage status - with mortgage (%)
Mortgage status - with second mortgage (%)
Mortgage status - with home equity loan (%)
Mortgage status - with both second mortgage and home equity loan (%)
Mortgage status - without a mortgage (%)
Median year house/condo built
Median year apartment built
Household type by relationship - Male householder living alone (%)
Household type by relationship - Male householder not living alone (%)
Household type by relationship - Female householder living alone (%)
Household type by relationship - Female householder not living alone (%)
Household type by relationship - Opposite-Sex spouse (%)
Household type by relationship - Same-Sex spouse (%)
Household type by relationship - Opposite-Sex unmarried partner (%)
Household type by relationship - Same-Sex unmarried partner (%)
Household type by relationship - In group quarters (%)
Size of family households - 2-person household (%)
Size of family households - 3-person household (%)
Size of family households - 4-person household (%)
Size of family households - 5-person household (%)
Size of family households - 6-person household (%)
Size of family households - 7-or-more-person household (%)
Size of nonfamily households - 1-person household (%)
Size of nonfamily households - 2-person household (%)
Size of nonfamily households - 3-person household (%)
Size of nonfamily households - 4-person household (%)
Size of nonfamily households - 5-person household (%)
Size of nonfamily households - 6-person household (%)
Size of nonfamily households - 7-or-moreperson household (%)
Year house built - Built 2010 or later (%)
Year house built - Built 2000 to 2009 (%)
Year house built - Built 1990 to 1999 (%)
Year house built - Built 1980 to 1989 (%)
Year house built - Built 1970 to 1979 (%)
Year house built - Built 1960 to 1969 (%)
Year house built - Built 1950 to 1959 (%)
Year house built - Built 1940 to 1949 (%)
Year house built - Built 1939 or earlier (%)
Median number of rooms in houses and condos
Median number of rooms in apartments
Median number of bedrooms in owner occupied houses
Mean number of bedrooms in owner occupied houses
Median number of bedrooms in renter occupied houses
Mean number of bedrooms in renter occupied houses
Median number of vehichles in owner occupied houses
Mean number of vehichles in owner occupied houses
Median number of vehichles in renter occupied houses
Mean number of vehichles in renter occupied houses
Rooms in owner-occupied houses - 1 room (%)
Rooms in owner-occupied houses - 2 rooms (%)
Rooms in owner-occupied houses - 3 rooms (%)
Rooms in owner-occupied houses - 4 rooms (%)
Rooms in owner-occupied houses - 5 rooms (%)
Rooms in owner-occupied houses - 6 rooms (%)
Rooms in owner-occupied houses - 7 rooms (%)
Rooms in owner-occupied houses - 8 rooms (%)
Rooms in owner-occupied houses - 9+ rooms (%)
Rooms in renter-occupied houses - 1 room (%)
Rooms in renter-occupied houses - 2 rooms (%)
Rooms in renter-occupied houses - 3 rooms (%)
Rooms in renter-occupied houses - 4 rooms (%)
Rooms in renter-occupied houses - 5 rooms (%)
Rooms in renter-occupied houses - 6 rooms (%)
Rooms in renter-occupied houses - 7 rooms (%)
Rooms in renter-occupied houses - 8 rooms (%)
Rooms in renter-occupied houses - 9+ rooms (%)
Bedrooms in owner-occupied houses - no bedrooms (%)
Bedrooms in owner-occupied houses - 1 bedroom (%)
Bedrooms in owner-occupied houses - 2 bedrooms (%)
Bedrooms in owner-occupied houses - 3 bedrooms (%)
Bedrooms in owner-occupied houses - 4 bedrooms (%)
Bedrooms in owner-occupied houses - 5+ bedrooms (%)
Bedrooms in renter-occupied houses - no bedrooms (%)
Bedrooms in renter-occupied houses - 1 bedroom (%)
Bedrooms in renter-occupied houses - 2 bedrooms (%)
Bedrooms in renter-occupied houses - 3 bedrooms (%)
Bedrooms in renter-occupied houses - 4 bedrooms (%)
Bedrooms in renter-occupied houses - 5+ bedrooms (%)
Vehicles available in owner-occupied houses - no vehicle available (%)
Vehicles available in owner-occupied houses - 1 vehicle available(%)
Vehicles available in owner-occupied houses - 2 Vehicles available (%)
Vehicles available in owner-occupied houses - 3 Vehicles available (%)
Vehicles available in owner-occupied houses - 4 Vehicles available (%)
Vehicles available in owner-occupied houses - 5+ Vehicles available (%)
Vehicles available in renter-occupied houses - no vehicle available (%)
Vehicles available in renter-occupied houses - 1 vehicle available (%)
Vehicles available in renter-occupied houses - 2 Vehicles available (%)
Vehicles available in renter-occupied houses - 3 Vehicles available (%)
Vehicles available in renter-occupied houses - 4 Vehicles available (%)
Vehicles available in renter-occupied houses - 5+ Vehicles available (%)
Housing units in structures - 1, detached (%)
Housing units in structures - 1, attached (%)
Housing units in structures - 2 (%)
Housing units in structures - 3 or 4 (%)
Housing units in structures - 5 to 9 (%)
Housing units in structures - 10 to 19 (%)
Housing units in structures - 20 to 49 (%)
Housing units in structures - 50 or more (%)
Housing units in structures - Mobile home (%)
Housing units in structures - Boat, RV, van, etc. (%)
Housing units in structures - Owners - 1, detached (%)
Housing units in structures - Owners - 1, attached (%)
Housing units in structures - Owners - 2 (%)
Housing units in structures - Owners - 3 or 4 (%)
Housing units in structures - Owners - 5 to 9 (%)
Housing units in structures - Owners - 10 to 19 (%)
Housing units in structures - Owners - 20 to 49 (%)
Housing units in structures - Owners - 50 or more (%)
Housing units in structures - Owners - Mobile home (%)
Housing units in structures - Owners - Boat, RV, van, etc. (%)
Housing units in structures - Renters - 1, detached (%)
Housing units in structures - Renters - 1, attached (%)
Housing units in structures - Renters - 2 (%)
Housing units in structures - Renters - 3 or 4 (%)
Housing units in structures - Renters - 5 to 9 (%)
Housing units in structures - Renters - 10 to 19 (%)
Housing units in structures - Renters - 20 to 49 (%)
Housing units in structures - Renters - 50 or more (%)
Housing units in structures - Renters - Mobile home (%)
Housing units in structures - Renters - Boat, RV, van, etc. (%)
House/condo owner moved in on average (years ago)
Renter moved in on average (years ago)
Year householder moved into unit - Moved in 1999 to March 2000 (%)
Year householder moved into unit - Moved in 1999 to March 2000 (%) - White
Year householder moved into unit - Moved in 1999 to March 2000 (%) - Black or African American
Year householder moved into unit - Moved in 1999 to March 2000 (%) - Asian
Year householder moved into unit - Moved in 1999 to March 2000 (%) - Hispanic or Latino
Year householder moved into unit - Moved in 1999 to March 2000 (%) - American Indian and Alaska Native
Year householder moved into unit - Moved in 1999 to March 2000 (%) - Multirace
Year householder moved into unit - Moved in 1999 to March 2000 (%) - Other Race
Year householder moved into unit - Moved in 1995 to 1998 (%)
Year householder moved into unit - Moved in 1995 to 1998 (%) - White
Year householder moved into unit - Moved in 1995 to 1998 (%) - Black or African American
Year householder moved into unit - Moved in 1995 to 1998 (%) - Asian
Year householder moved into unit - Moved in 1995 to 1998 (%) - Hispanic or Latino
Year householder moved into unit - Moved in 1995 to 1998 (%) - American Indian and Alaska Native
Year householder moved into unit - Moved in 1995 to 1998 (%) - Multirace
Year householder moved into unit - Moved in 1995 to 1998 (%) - Other Race
Year householder moved into unit - Moved in 1990 to 1994 (%)
Year householder moved into unit - Moved in 1990 to 1994 (%) - White
Year householder moved into unit - Moved in 1990 to 1994 (%) - Black or African American
Year householder moved into unit - Moved in 1990 to 1994 (%) - Asian
Year householder moved into unit - Moved in 1990 to 1994 (%) - Hispanic or Latino
Year householder moved into unit - Moved in 1990 to 1994 (%) - American Indian and Alaska Native
Year householder moved into unit - Moved in 1990 to 1994 (%) - Multirace
Year householder moved into unit - Moved in 1990 to 1994 (%) - Other Race
Year householder moved into unit - Moved in 1980 to 1989 (%)
Year householder moved into unit - Moved in 1980 to 1989 (%) - White
Year householder moved into unit - Moved in 1980 to 1989 (%) - Black or African American
Year householder moved into unit - Moved in 1980 to 1989 (%) - Asian
Year householder moved into unit - Moved in 1980 to 1989 (%) - Hispanic or Latino
Year householder moved into unit - Moved in 1980 to 1989 (%) - American Indian and Alaska Native
Year householder moved into unit - Moved in 1980 to 1989 (%) - Multirace
Year householder moved into unit - Moved in 1980 to 1989 (%) - Other Race
Year householder moved into unit - Moved in 1970 to 1979 (%)
Year householder moved into unit - Moved in 1970 to 1979 (%) - White
Year householder moved into unit - Moved in 1970 to 1979 (%) - Black or African American
Year householder moved into unit - Moved in 1970 to 1979 (%) - Asian
Year householder moved into unit - Moved in 1970 to 1979 (%) - Hispanic or Latino
Year householder moved into unit - Moved in 1970 to 1979 (%) - American Indian and Alaska Native
Year householder moved into unit - Moved in 1970 to 1979 (%) - Multirace
Year householder moved into unit - Moved in 1970 to 1979 (%) - Other Race
Year householder moved into unit - Moved in 1969 or earlier (%)
Year householder moved into unit - Moved in 1969 or earlier (%) - White
Year householder moved into unit - Moved in 1969 or earlier (%) - Black or African American
Year householder moved into unit - Moved in 1969 or earlier (%) - Asian
Year householder moved into unit - Moved in 1969 or earlier (%) - Hispanic or Latino
Year householder moved into unit - Moved in 1969 or earlier (%) - American Indian and Alaska Native
Year householder moved into unit - Moved in 1969 or earlier (%) - Multirace
Year householder moved into unit - Moved in 1969 or earlier (%) - Other Race
Housing units lacking complete plumbing facilities (%)
Housing units lacking complete kitchen facilities (%)
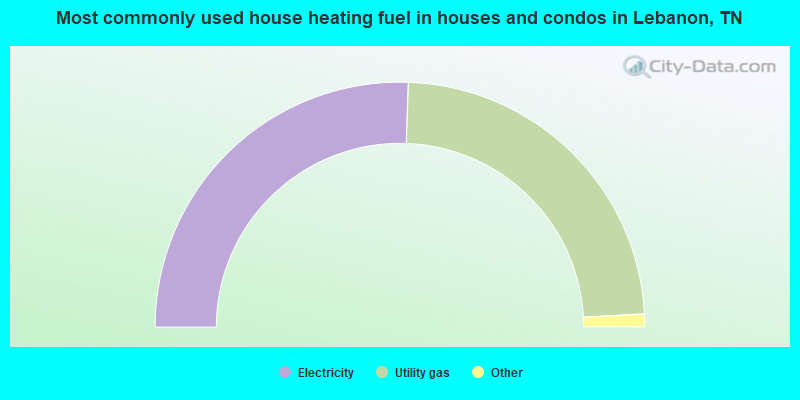
House heating fuel used in houses and condos - Utility gas (%)
House heating fuel used in houses and condos - Bottled, tank, or LP gas (%)
House heating fuel used in houses and condos - Electricity (%)
House heating fuel used in houses and condos - Fuel oil, kerosene, etc. (%)
House heating fuel used in houses and condos - Coal or coke (%)
House heating fuel used in houses and condos - Wood (%)
House heating fuel used in houses and condos - Solar energy (%)
House heating fuel used in houses and condos - Other fuel (%)
House heating fuel used in houses and condos - No fuel used (%)
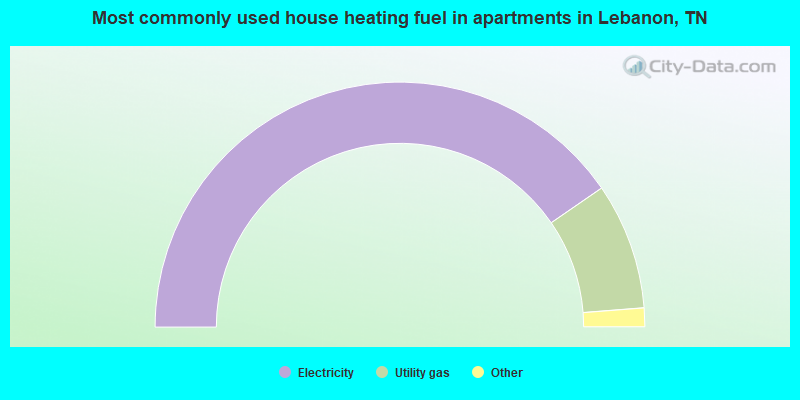
House heating fuel used in apartments - Utility gas (%)
House heating fuel used in apartments - Bottled, tank, or LP gas (%)
House heating fuel used in apartments - Electricity (%)
House heating fuel used in apartments - Fuel oil, kerosene, etc. (%)
House heating fuel used in apartments - Coal or coke (%)
House heating fuel used in apartments - Wood (%)
House heating fuel used in apartments - Solar energy (%)
House heating fuel used in apartments - Other fuel (%)
House heating fuel used in apartments - No fuel used (%)
Latest news about housing in Lebanon, TN collected exclusively by city-data.com from local newspapers, TV, and radio stations
Median year house/condo built: 2004Median year apartment built: 1994Household type by relationship:
Households: 42,071
Male householders: 7,508 (1,719 living alone ), Female householders: 8,457 (2,888 living alone )7,272 spouses (7,146 opposite-sex spouses ), 1,635 unmarried partners , (1,540 opposite-sex unmarried partners ), 11,521 children (10,150 natural , 618 adopted , 751 stepchildren ), 497 grandchildren , 458 brothers or sisters , 733 parents , 37 foster children , 524 other relatives , 1,732 non-relatives In group quarters: 1,691
Size of family households: 4,385 2-persons , 2,674 3-persons , 2,008 4-persons , 1,164 5-persons , 468 6-persons , 54 7-or-more-persons .
Size of nonfamily households: 4,841 1-person , 452 2-persons , 323 3-persons , 147 4-persons , 10 7-or-more-persons .
5,792 married couples with children. single-parent households (475 men , 2,424 women ).
92.4% of residents of Lebanon speak English at home. of residents speak Spanish at home (40% speak English very well , 22% speak English well , 25% speak English not well , 12% don't speak English at all ).of residents speak other Indo-European language at home (84% speak English very well , 2% speak English well , 10% speak English not well , 4% don't speak English at all ).of residents speak Asian or Pacific Island language at home (29% speak English very well , 67% speak English well , 3% speak English not well , 1% don't speak English at all ).of residents speak other language at home (19% speak English very well , 49% speak English well , 32% speak English not well ).
Foreign born population: 2,535 (6.0%)of them are naturalized citizens )
Median number of rooms in houses and condos:
Median number of rooms in apartments
Owner-occupied Renter-occupied
Rooms in owner-occupied houses in Lebanon, Tennessee
44 1 room 0 2 rooms 94 3 rooms 528 4 rooms 1,948 5 rooms 2,103 6 rooms 2,191 7 rooms 1,349 8 rooms 1,577 9+ rooms
Rooms in renter-occupied apartments in Lebanon, Tennessee
249 1 room 300 2 rooms 1,245 3 rooms 2,196 4 rooms 1,233 5 rooms 763 6 rooms 612 7 rooms 81 8 rooms 71 9+ rooms
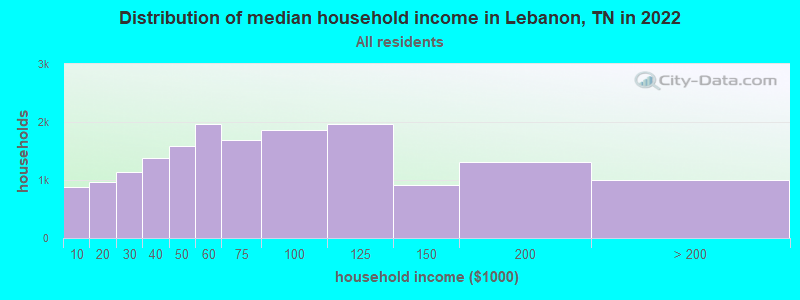
Lebanon, TN household income distribution 874 Less than $10,000971 $10,000 to $19,9991,144 $20,000 to $29,9991,387 $30,000 to $39,9991,589 $40,000 to $49,9991,960 $50,000 to $59,9991,696 $60,000 to $74,9991,854 $75,000 to $99,9991,965 $100,000 to $124,999921 $125,000 to $149,9991,302 $150,000 to $199,9991,004 $200,000 or more
Home value of owner - occupied houses in 2022 in Lebanon, TN 32 Less than $10,00023 $10,000 to $14,99910 $15,000 to $19,99961 $20,000 to $24,99916 $25,000 to $29,99911 $35,000 to $39,99923 $40,000 to $49,99936 $50,000 to $59,99911 $60,000 to $69,99922 $70,000 to $79,99969 $80,000 to $89,999107 $90,000 to $99,999152 $100,000 to $124,999125 $125,000 to $149,999251 $150,000 to $174,999141 $175,000 to $199,9991,118 $200,000 to $249,9991,226 $250,000 to $299,9993,213 $300,000 to $399,9991,771 $400,000 to $499,9991,624 $500,000 to $749,999248 $750,000 to $999,99991 $1,000,000 to $1,499,99935 $2,000,000 or moreRent paid by renters in 2022 in Lebanon, TN 21 Less than $10030 $100 to $14994 $150 to $199125 $200 to $24917 $250 to $299137 $300 to $34950 $350 to $39950 $400 to $449105 $450 to $49992 $550 to $599208 $600 to $649103 $650 to $699127 $700 to $749118 $750 to $799620 $800 to $8991,201 $900 to $9991,409 $1,000 to $1,2491,086 $1,250 to $1,499394 $1,500 to $1,99997 $2,000 to $2,49958 $3,000 to $3,49911 $3,500 or more259 No cash rent
Percentage of workers working in this county: 75.7%Number of people working at home: 2,737 (13.9% of all workers )
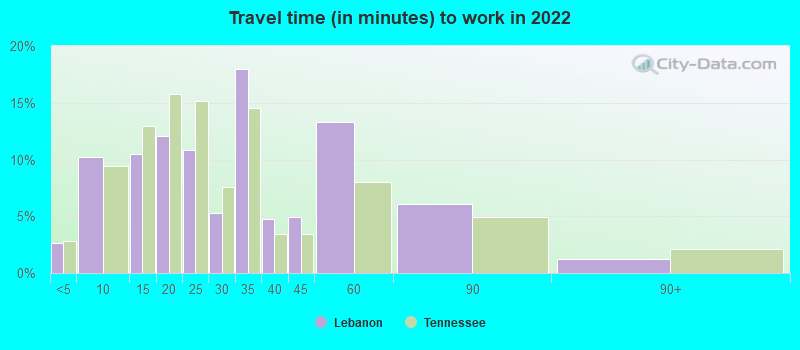
Travel time to work (commute)
Less than 5 minutes: 8275 to 9 minutes: 2,93010 to 14 minutes: 2,00215 to 19 minutes: 2,33920 to 24 minutes: 1,59125 to 29 minutes: 71430 to 34 minutes: 2,38235 to 39 minutes: 55140 to 44 minutes: 1,02045 to 59 minutes: 1,38260 to 89 minutes: 1,35790 or more minutes: 111
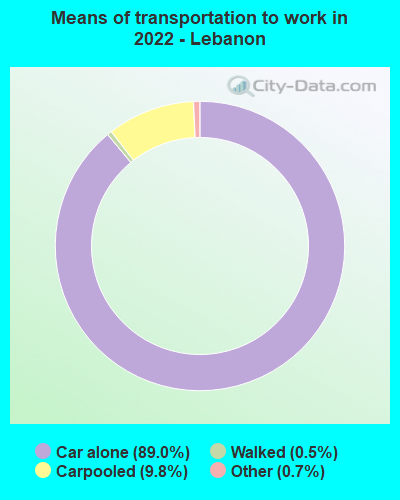
Means of transportation to work:
Drove a car alone: 25,715 (79.5%)Carpooled: 2,998 (9.3%)Bus : 18 (0.1%)Light rail, streetcar or trolley : 1 (0.0%)Taxi: 248 (0.8%)Walked: 136 (0.4%)Worked at home: 2,737 (8.5%)
Unemployment by race in 2022
Unemployment rate for White non-Hispanic residents 2.3% Males1.5% FemalesUnemployment rate for Black residents 1.8% Males1.4% FemalesUnemployment rate for other race residents 30.0% Males10.2% FemalesUnemployment rate for two or more race residents 1.3% MalesUnemployment rate for Hispanic or Latino residents 9.4% Males7.0% Females
Year of entry for the foreign-born population in Lebanon, Tennessee
1,534 2010 or later 571 2000 to 2009 254 1990 to 1999 74 1980 to 1989 73 1970 to 1979 33 Before 1970
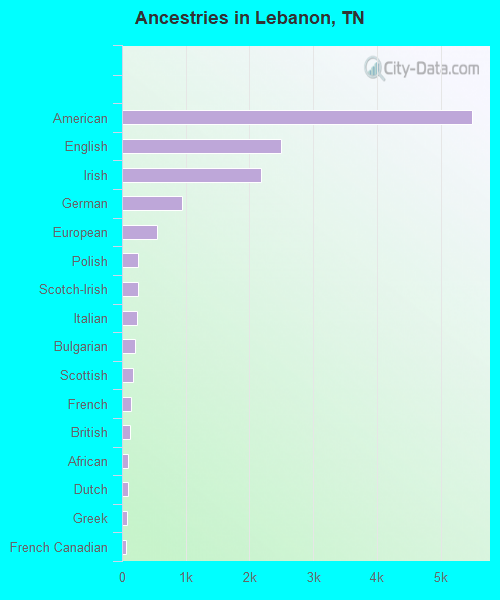
First ancestries reported:
American: 5,487 (25.6%)
English: 2,495 (11.7%)
Irish: 2,188 (10.2%)
German: 948 (4.4%)
European: 557 (2.6%)
Polish: 252 (1.2%)
Scotch-Irish: 248 (1.2%)
Italian: 234 (1.1%)
Bulgarian: 201 (0.9%)
Scottish: 166 (0.8%)
French: 138 (0.6%)
British: 130 (0.6%)
African: 100 (0.5%)
Dutch: 93 (0.4%)
Greek: 86 (0.4%)
French Canadian: 66 (0.3%)
Northern European: 42 (0.2%)
Jamaican: 41 (0.2%)
South African: 34 (0.2%)
Welsh: 32 (0.1%)
Swedish: 29 (0.1%)
Russian: 27 (0.1%)
Hungarian: 24 (0.1%)
Portuguese: 22 (0.1%)
Ghanaian: 18 (0.08%)
Brazilian: 16 (0.07%)
Eastern European: 16 (0.07%)
Finnish: 15 (0.07%)
Egyptian: 14 (0.07%)
Israeli: 14 (0.07%)
Romanian: 14 (0.07%)
Canadian: 13 (0.06%)
Trinidadian and Tobagonian: 11 (0.05%)
Serbian: 8 (0.04%)
Czech: 7 (0.03%)
Somali: 6 (0.03%)
Nigerian: 2 (0.01%) Most common places of birth for foreign-born residents (%): Mexico Lebanon:
18.7% (468)Tennessee:
23.0% (86,435)
Venezuela Lebanon:
15.0% (374)Tennessee:
1.6% (5,936)
Guatemala Lebanon:
8.9% (222)Tennessee:
5.7% (21,286)
Honduras Lebanon:
7.4% (184)Tennessee:
4.6% (17,433)
Bulgaria Lebanon:
7.0% (175)Tennessee:
0.2% (608)
India Lebanon:
6.5% (163)Tennessee:
6.1% (23,079)
El Salvador Lebanon:
6.3% (158)Tennessee:
2.7% (10,313)
Canada Lebanon:
4.4% (111)Tennessee:
2.7% (10,295)
Philippines Lebanon:
3.3% (82)Tennessee:
3.1% (11,640)
Thailand Lebanon:
3.1% (77)Tennessee:
0.8% (3,002)
Brazil Lebanon:
3.1% (77)Tennessee:
0.8% (3,098)
Egypt Lebanon:
3.0% (76)Tennessee:
3.1% (11,761)
Dominican Republic Lebanon:
3.0% (74)Tennessee:
0.5% (1,963)
Germany Lebanon:
2.9% (73)Tennessee:
2.2% (8,261)
Korea Lebanon:
2.1% (52)Tennessee:
2.3% (8,490)
China, excluding Hong Kong and Taiwan Lebanon:
2.0% (50)Tennessee:
3.3% (12,582)
Place of birth for U.S.-born residents:
This state: 22,699Other state: 16,425Northeast: 1,583Midwest: 4,432South: 7,479West: 2,867 84.6% of Lebanon residents lived in the same house 1 years ago.
Out of people who lived in different houses, 24.9% lived in this county.
Out of people who lived in different counties, 49.1% lived in Tennessee.
Lebanon:
84.6%State average:
87.0%
Education attainment for males 25 years and older:
No schooling: 166Nursery to 4th grade: 775th and 6th grade: 507th and 8th grade: 2899th grade: 7910th grade: 6511th grade: 17012th grade, no diploma: 523High school graduate (or equivalency): 4,556Less than 1 year of college: 754Some college more than 1 year, no degree: 1,477Associate degree: 1,235Bachelor's degree: 2,958Master's degree: 706Professional school degree: 104Doctorate degree: 198
Education attainment for females 25 years and older:
No schooling: 132Nursery to 4th grade: 305th and 6th grade: 387th and 8th grade: 2489th grade: 5710th grade: 10511th grade: 29812th grade, no diploma: 318High school graduate (or equivalency): 4,699Less than 1 year of college: 1,005Some college more than 1 year, no degree: 2,550Associate degree: 1,592Bachelor's degree: 3,127Master's degree: 1,022Professional school degree: 91Doctorate degree: 208
Housing units in structures:
One, detached: 10,329One, attached: 950Two: 1,1233 or 4: 7935 to 9: 1,13410 to 19: 99720 to 49: 41350 or more: 674Mobile homes: 434Boats, RVs, vans, etc.: 34Housing units lacking complete plumbing facilities in 2022: 0.5%Housing units lacking complete kitchen facilities in 2022: 2.0%House/condo owner moved in on average 7 years ago
Renter moved in on average 3 years ago
Private vs. public school enrollment:
Students in private schools in grades 1 to 8 (elementary and middle school): 241 Students in private schools in grades 9 to 12 (high school): 196 Here:
14.8%Tennessee:
16.2%
Students in private undergraduate colleges: 550 Here:
34.9%Tennessee:
23.5%