Hillandale, MD (Maryland) Houses and Residents
| Hillandale: | $511,615 |
| Maryland: | $398,100 |
Mean price in 2022:
Detached houses: $535,241
Here: $535,241 State: $526,819
Total population: 6,043 (Urban population: 2,975, Rural population: 0)
Houses: 1,642 (1,527 occupied: 1,346 owner occupied, 191 renter occupied)
| % of renters here: | 12% |
| State: | 32% |
Housing density: 1,326 houses/condos per square mile
Median price asked for vacant for-sale houses and condos in 2022 in this county: $868,821.
Median contract rent in 2022: over $2,000 (lower quartile is $1,678, upper quartile is over $2,000)
Median gross rent in Hillandale, MD in 2022: over $2,000
Housing units in Hillandale with a mortgage: 756 (30 second mortgage, 0 home equity loan, 31 both second mortgage and home equity loan)
Houses without a mortgage: 0
Median household income for houses/condos with a mortgage: $194,515
Median household income for apartments without a mortgage: $111,307
Median monthly housing costs: $1,938
Compare current foreclosures near Hillandale, MD:
| Photo | Address | Area | Beds / Baths | Price | Details |
|---|---|---|---|---|---|

|
#1
Cathedral Ave NW Apt 108
Washington, DC 20016
|
765 sq. feet
|
1 baths 1 beds |
$269,900
|
show details |

|
#2
17th St NW Apt 504
Washington, DC 20009
|
800 sq. feet
|
1 baths 1 beds |
$405,000
|
show details |

|
#3
Elkhorn Ln
Bowie, MD 20716
|
1,514 sq. feet
|
2 baths 3 beds |
$415,000
|
show details |

|
#4
Henson Ln
Temple Hills, MD 20748
|
1,566 sq. feet
|
2 baths 3 beds |
$300,000
|
show details |

|
#5
Monroe St NW
Washington, DC 20010
|
- sq. feet
|
2 baths 2 beds |
$665,000
|
show details |

|
#6
Wilson Ln Apt 204
Mc Lean, VA 22102
|
925 sq. feet
|
1 baths 2 beds |
$359,900
|
show details |

|
#7
3rd St
Lanham, MD 20706
|
1,104 sq. feet
|
2 baths 3 beds |
$369,200
|
show details |

|
#8
Buchanan St NE
Washington, DC 20017
|
1,240 sq. feet
|
2 baths 3 beds |
$325,000
|
show details |

|
#9
Crafford Pl
Fort Washington, MD 20744
|
1,890 sq. feet
|
1 baths 3 beds |
$265,900
|
show details |

|
#10
Heming Ln
Bowie, MD 20716
|
1,800 sq. feet
|
2 baths 3 beds |
$400,000
|
show details |
| Photo | Address | Area | Beds / Baths | Price | Details |
|---|---|---|---|---|---|

|
#11
Addison Rd
Capitol Heights, MD 20743
|
1,400 sq. feet
|
1 baths 3 beds |
$260,000
|
show details |

|
#12
Mandan Rd Apt 103 Unit 621
Greenbelt, MD 20770
|
1,420 sq. feet
|
2 baths 3 beds |
$179,900
|
show details |

|
#13
Hammersmith Cir
Silver Spring, MD 20906
|
1,152 sq. feet
|
1 baths 3 beds |
$328,600
|
show details |

|
#14
19th St NW
Washington, DC 20036
|
2,515 sq. feet
|
6 baths 8 beds |
$1,574,900
|
show details |

|
#15
Brooke Knolls Rd
Gaithersburg, MD 20882
|
1,704 sq. feet
|
3 baths 4 beds |
$681,500
|
show details |

|
#16
Interlachen Dr Apt 111
Silver Spring, MD 20906
|
965 sq. feet
|
1 baths 2 beds |
$148,000
|
show details |

|
#17
Pooks Hill Rd Apt 1612s
Bethesda, MD 20814
|
1,250 sq. feet
|
1 baths 2 beds |
$289,000
|
show details |

|
#18
Eastern Ave NE
Washington, DC 20011
|
1,024 sq. feet
|
1 baths 3 beds |
$395,000
|
show details |

|
#19
Pickett Dr
Suitland, MD 20746
|
1,296 sq. feet
|
1 baths 2 beds |
$335,000
|
show details |

|
#20
Applegarth Pl
Capitol Heights, MD 20743
|
1,200 sq. feet
|
1 baths 3 beds |
$314,900
|
show details |
| Photo | Address | Area | Beds / Baths | Price | Details |
|---|---|---|---|---|---|

|
#21
Fitzgibbon Ct
Bowie, MD 20721
|
1,300 sq. feet
|
2 baths 3 beds |
$369,200
|
show details |

|
#22
Wilson Bridge Dr Unit #6770 A-2
Oxon Hill, MD 20745
|
- sq. feet
|
1 baths 1 beds |
$99,750
|
show details |

|
#23
T St SE Apt 3
Washington, DC 20020
|
- sq. feet
|
2 baths 4 beds |
$307,500
|
show details |

|
#24
Delaware Ave SW Apt N720
Washington, DC 20024
|
- sq. feet
|
1 baths 1 beds |
$149,900
|
show details |

|
#25
Brooke Ln
Upper Marlboro, MD 20772
|
- sq. feet
|
5 baths 6 beds |
$949,000
|
show details |

|
#26
Holbrook Ter NE
Washington, DC 20002
|
3,164 sq. feet
|
4 baths 8 beds |
show details | |

|
#27
Oakwood St SE Apt B5
Washington, DC 20032
|
628 sq. feet
|
1 baths 1 beds |
show details | |

|
#28
Nash St NE
Washington, DC 20019
|
896 sq. feet
|
1 baths 2 beds |
show details | |

|
#29
N Capitol St NW
Washington, DC 20002
|
1,680 sq. feet
|
1 baths 3 beds |
show details | |

|
#30
Farragut St NW
Washington, DC 20011
|
1,504 sq. feet
|
2 baths 3 beds |
show details |
| Photo | Address | Area | Beds / Baths | Price | Details |
|---|---|---|---|---|---|

|
#31
Columbia Rd NW Apt 102
Washington, DC 20009
|
718 sq. feet
|
1 baths 2 beds |
show details | |

|
#32
52nd St NW
Washington, DC 20016
|
4,076 sq. feet
|
4 baths 4 beds |
show details | |

|
#33
35th St NE
Washington, DC 20019
|
780 sq. feet
|
1 baths 2 beds |
show details | |

|
#34
35th St NE
Washington, DC 20019
|
832 sq. feet
|
1 baths 2 beds |
show details | |

|
#35
Naylor Rd SE Apt 302
Washington, DC 20020
|
848 sq. feet
|
1 baths 2 beds |
show details | |

|
#36
28th St SE
Washington, DC 20020
|
1,200 sq. feet
|
3 baths 3 beds |
show details | |

|
#37
Brooks St NE
Washington, DC 20019
|
1,440 sq. feet
|
2 baths 2 beds |
show details | |

|
#38
Buckland Ct
Fort Washington, MD 20744
|
1,496 sq. feet
|
2 baths 3 beds |
show details | |

|
#39
Irving St SE
Washington, DC 20020
|
602 sq. feet
|
1 baths 2 beds |
show details | |

|
#40
47th St NE
Washington, DC 20019
|
2,363 sq. feet
|
2 baths 5 beds |
show details |
| Photo | Address | Area | Beds / Baths | Price | Details |
|---|---|---|---|---|---|

|
#41
Forest Run Dr # B
District Heights, MD 20747
|
2,267 sq. feet
|
3 baths 3 beds |
show details | |

|
#42
M St NE
Washington, DC 20002
|
1,252 sq. feet
|
1 baths 3 beds |
show details | |

|
#43
Malcolm X Ave SE
Washington, DC 20032
|
1,254 sq. feet
|
2 baths 4 beds |
show details | |

|
#44
8th St NW
Washington, DC 20011
|
1,054 sq. feet
|
3 baths 3 beds |
show details | |

|
#45
Varnum Pl NE
Washington, DC 20017
|
1,188 sq. feet
|
2 baths 3 beds |
show details | |

|
#46
Irving St SE
Washington, DC 20020
|
1,200 sq. feet
|
1 baths 3 beds |
show details | |

|
#47
Clay Pl NE
Washington, DC 20019
|
832 sq. feet
|
1 baths 2 beds |
show details | |

|
#48
Galloway St NE
Washington, DC 20017
|
1,444 sq. feet
|
2 baths 4 beds |
show details | |

|
#49
8th St NE
Washington, DC 20002
|
1,444 sq. feet
|
1 baths 3 beds |
show details | |

|
Check over 1 million property listings on Foreclosure.com!
|
browse all offers | |||

Latest news about housing in Hillandale, MD collected exclusively by city-data.com from local newspapers, TV, and radio stations

 | Mid Century Houses in PG County - Maybe??? (13 replies) |
| why is MOCo overrrated? (43 replies) |
| PG Mall Development: Chick-Fil-A (211 replies) |
| relocating to work at FDA in white oak--where to rent/live? (15 replies) |
| Reasonably priced and safe suburbs? (11 replies) |
| Relocating to Silver Spring w/workplace on Tech Road. Where can I Live (11 replies) |

Median year apartment built: 1965
Household type by relationship:
Households: 4,981- Male householders: 694 (114 living alone), Female householders: 814 (194 living alone)
1,029 spouses (1,007 opposite-sex spouses), 71 unmarried partners, (71 opposite-sex unmarried partners), 1,643 children (1,550 natural, 19 adopted, 72 stepchildren), 61 grandchildren, 109 brothers or sisters, 218 parents, 0 foster children, 136 other relatives, 138 non-relatives
- In group quarters: 63
Size of family households: 399 2-persons, 250 3-persons, 184 4-persons, 180 5-persons, 77 6-persons, 61 7-or-more-persons.
Size of nonfamily households: 352 1-person, 29 2-persons.
749 married couples with children.
122 single-parent households (40 men, 82 women).
59.4% of residents of Hillandale speak English at home.
23.9% of residents speak Spanish at home (49% speak English very well, 21% speak English well, 22% speak English not well, 8% don't speak English at all).
8.1% of residents speak other Indo-European language at home (91% speak English very well, 5% speak English well, 5% speak English not well).
3.1% of residents speak Asian or Pacific Island language at home (36% speak English very well, 27% speak English well, 36% speak English not well).
6.9% of residents speak other language at home (95% speak English very well, 5% don't speak English at all).
Foreign born population: 1,779 (35.7%)
(61.0% of them are naturalized citizens)
| Here: | 8.2 |
| State: | 7.3 |
| Here: | 7.4 |
| State: | 4.2 |

- Bedrooms in owner-occupied houses and condos in Hillandale, Maryland
- 0no bedroom
- 31 bedroom
- 532 bedrooms
- 3893 bedrooms
- 6964 bedrooms
- 2065+ bedrooms

- Bedrooms in renter-occupied apartments in Hillandale, Maryland
- 0no bedroom
- 111 bedroom
- 02 bedrooms
- 583 bedrooms
- 654 bedrooms
- 585+ bedrooms

- Cars and other vehicles available in Hillandale in owner-occupied houses/condos
- 9no vehicle
- 3021 vehicle
- 5822 vehicles
- 2663 vehicles
- 904 vehicles
- 975+ vehicles

- Cars and other vehicles available in Hillandale in renter-occupied apartments
- 11no vehicle
- 431 vehicle
- 802 vehicles
- 403 vehicles
- 184 vehicles
- 05+ vehicles

- Rooms in owner-occupied houses in Hillandale, Maryland
- 01 room
- 02 rooms
- 03 rooms
- 304 rooms
- 395 rooms
- 1306 rooms
- 1047 rooms
- 4628 rooms
- 5829+ rooms

- Rooms in renter-occupied apartments in Hillandale, Maryland
- 01 room
- 02 rooms
- 03 rooms
- 114 rooms
- 365 rooms
- 06 rooms
- 557 rooms
- 408 rooms
- 519+ rooms


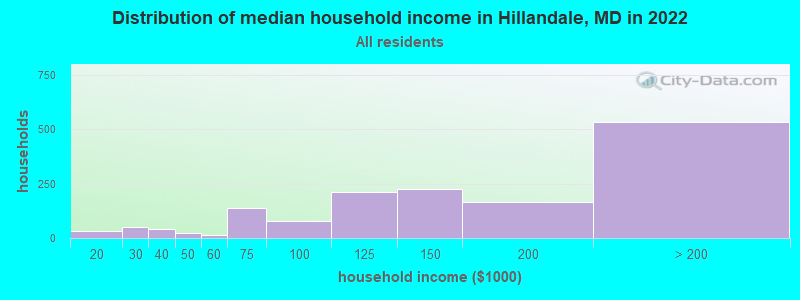
Hillandale, MD household income distribution

- 3Less than $10,000
- 32$10,000 to $19,999
- 51$20,000 to $29,999
- 41$30,000 to $39,999
- 25$40,000 to $49,999
- 16$50,000 to $59,999
- 138$60,000 to $74,999
- 76$75,000 to $99,999
- 213$100,000 to $124,999
- 226$125,000 to $149,999
- 165$150,000 to $199,999
- 534$200,000 or more
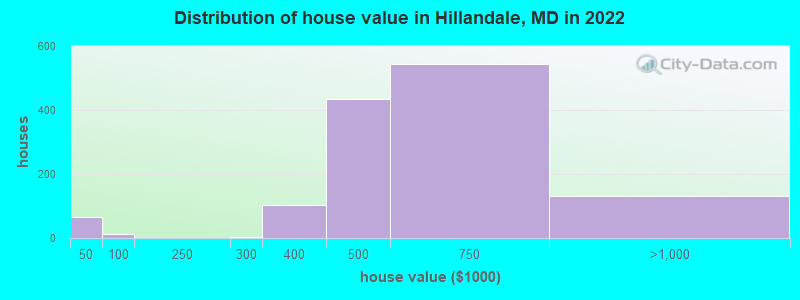
Home value of owner - occupied houses in 2022 in Hillandale, MD
-
- 47Less than $10,000
- 19$25,000 to $29,999
- 13$50,000 to $59,999
- 2$250,000 to $299,999
- 102$300,000 to $399,999
- 434$400,000 to $499,999
- 545$500,000 to $749,999
- 129$750,000 to $999,999
Rent paid by renters in 2022 in Hillandale, MD
-
- 82$1,500 to $1,999
- 23$2,000 to $2,499
- 36$2,500 to $2,999
- 19$3,000 to $3,499
- 11No cash rent


Percentage of workers working in this county: 51.6%
Number of people working at home: 455 (16.8% of all workers)
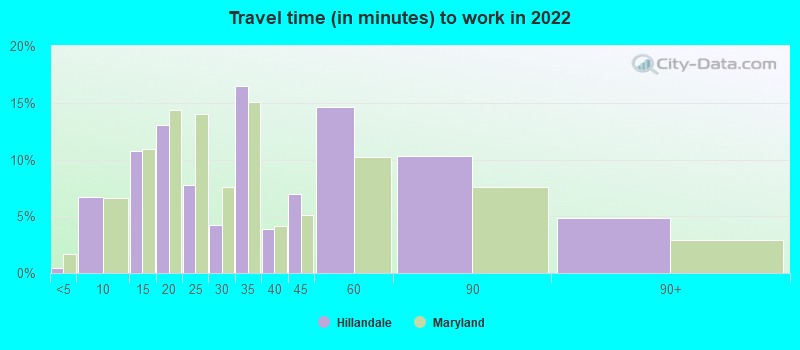
Travel time to work (commute)
- Less than 5 minutes: 10
- 5 to 9 minutes: 139
- 10 to 14 minutes: 115
- 15 to 19 minutes: 189
- 20 to 24 minutes: 269
- 25 to 29 minutes: 221
- 30 to 34 minutes: 420
- 35 to 39 minutes: 82
- 40 to 44 minutes: 325
- 45 to 59 minutes: 235
- 60 to 89 minutes: 156
- 90 or more minutes: 17
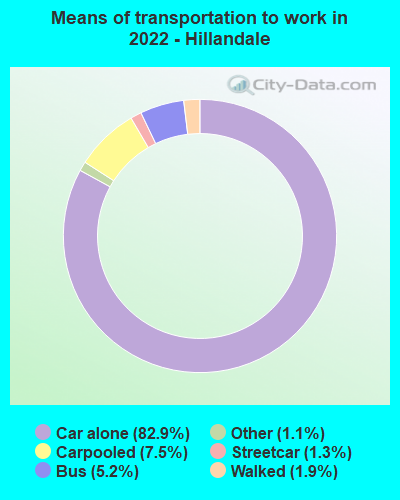
Means of transportation to work:
- Drove a car alone: 2,082 (68.0%)
- Carpooled: 200 (6.5%)
- Bus: 113 (3.7%)
- Subway or elevated rail: 26 (0.8%)
- Taxi: 30 (1.0%)
- Walked: 41 (1.3%)
- Worked at home: 455 (14.9%)

- Unemployment by race in 2022
- Unemployment rate for White non-Hispanic residents
- 3.8%Males
- 3.4%Females
- Unemployment rate for Black residents
- 8.9%Males
- 12.6%Females
- Unemployment rate for American Indian and Alaska Native residents
- 64.7%Females
- Unemployment rate for Asian residents
- 9.5%Males
- 38.2%Females
- Unemployment rate for other race residents
- 3.1%Females
- Unemployment rate for Hispanic or Latino residents
- 9.4%Females

- Year of entry for the foreign-born population in Hillandale, Maryland
- 3922010 or later
- 5432000 to 2009
- 2361990 to 1999
- 2141980 to 1989
- 1981970 to 1979
- 104Before 1970

First ancestries reported:
- Haitian: 116 (4.3%)
- English: 96 (3.6%)
- German: 71 (2.6%)
- Irish: 60 (2.2%)
- Ethiopian: 58 (2.2%)
- American: 54 (2.0%)
- Nigerian: 52 (1.9%)
- Greek: 45 (1.7%)
- European: 41 (1.5%)
- Jamaican: 41 (1.5%)
- Italian: 37 (1.4%)
- Yugoslavian: 31 (1.2%)
- Ukrainian: 30 (1.1%)
- French: 29 (1.1%)
- Ghanaian: 23 (0.9%)
- Polish: 19 (0.7%)
- Guyanese: 18 (0.7%)
- Scottish: 15 (0.6%)
- British: 11 (0.4%)
- Northern European: 10 (0.4%)
- Iranian: 9 (0.3%)
- Hungarian: 7 (0.3%)
- Trinidadian and Tobagonian: 7 (0.3%)
- Egyptian: 4 (0.1%)
- French Canadian: 3 (0.1%)
- Czech: 1 (0.04%)
Most common places of birth for foreign-born residents (%):
| Hillandale: | 21.9% (390) |
| Maryland: | 12.0% (115,412) |
| Hillandale: | 7.0% (124) |
| Maryland: | 1.4% (13,947) |
| Hillandale: | 6.0% (107) |
| Maryland: | 6.4% (61,725) |
| Hillandale: | 5.6% (100) |
| Maryland: | 2.5% (23,969) |
| Hillandale: | 4.3% (76) |
| Maryland: | 0.8% (8,109) |
| Hillandale: | 3.9% (69) |
| Maryland: | 0.7% (6,317) |
| Hillandale: | 3.8% (68) |
| Maryland: | 4.6% (44,825) |
| Hillandale: | 3.5% (62) |
| Maryland: | 4.4% (42,350) |
| Hillandale: | 3.3% (58) |
| Maryland: | 3.2% (30,870) |
| Hillandale: | 2.9% (51) |
| Maryland: | 0.4% (4,118) |
| Hillandale: | 2.6% (46) |
| Maryland: | 0.9% (9,100) |
| Hillandale: | 2.5% (45) |
| Maryland: | 0.4% (4,282) |
| Hillandale: | 2.2% (39) |
| Maryland: | 0.3% (2,415) |
| Hillandale: | 2.2% (39) |
| Maryland: | 0.6% (5,899) |
| Hillandale: | 2.1% (37) |
| Maryland: | 3.5% (34,065) |
| Hillandale: | 2.0% (36) |
| Maryland: | 4.6% (44,742) |
| Hillandale: | 2.0% (35) |
| Maryland: | 2.8% (27,444) |
| Hillandale: | 1.9% (33) |
| Maryland: | 0.9% (8,603) |
| Hillandale: | 1.9% (33) |
| Maryland: | 1.8% (17,161) |
| Hillandale: | 1.7% (30) |
| Maryland: | 0.3% (3,199) |
Place of birth for U.S.-born residents:
- This state: 1,272
- Other state: 1,618
- Northeast: 402
- Midwest: 73
- South: 1,054
- West: 103
86.5% of Hillandale residents lived in the same house 1 years ago.
Out of people who lived in different houses, 37.8% lived in this county.
Out of people who lived in different counties, 63.5% lived in Maryland.
| Hillandale: | 86.5% |
| State average: | 88.5% |
Education attainment for males 25 years and older:
- No schooling: 82
- Nursery to 4th grade: 5
- 5th and 6th grade: 17
- 7th and 8th grade: 27
- 9th grade: 40
- 10th grade: 3
- 11th grade: 0
- 12th grade, no diploma: 80
- High school graduate (or equivalency): 428
- Less than 1 year of college: 53
- Some college more than 1 year, no degree: 185
- Associate degree: 70
- Bachelor's degree: 371
- Master's degree: 211
- Professional school degree: 95
- Doctorate degree: 104

Education attainment for females 25 years and older:
- No schooling: 83
- Nursery to 4th grade: 78
- 5th and 6th grade: 25
- 7th and 8th grade: 19
- 9th grade: 44
- 10th grade: 0
- 11th grade: 0
- 12th grade, no diploma: 34
- High school graduate (or equivalency): 279
- Less than 1 year of college: 31
- Some college more than 1 year, no degree: 146
- Associate degree: 88
- Bachelor's degree: 377
- Master's degree: 288
- Professional school degree: 127
- Doctorate degree: 95


Housing units in structures:
- One, detached: 1,530
- One, attached: 25
- 20 to 49: 37
- 50 or more: 50
House/condo owner moved in on average 18 years ago
Renter moved in on average 1 years ago

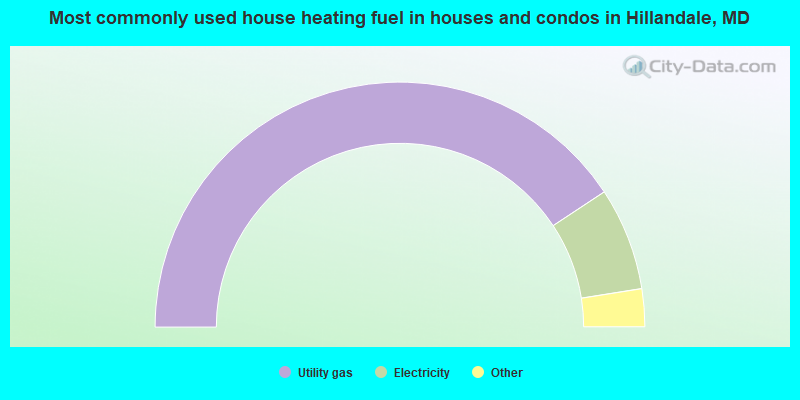
- 81.5%Utility gas
- 13.6%Electricity
- 2.5%Bottled, tank, or LP gas
- 2.4%Fuel oil, kerosene, etc.
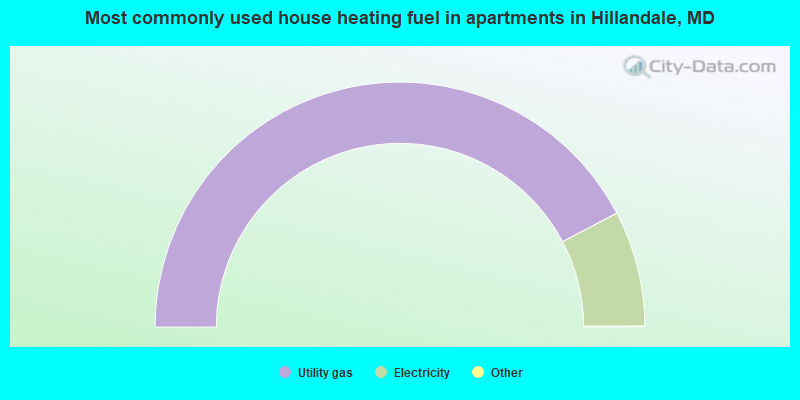
- 84.7%Utility gas
- 15.3%Electricity
Private vs. public school enrollment:
| Here: | 16.1% |
| Maryland: | 15.2% |
| Here: | 24.7% |
| Maryland: | 14.4% |
| Here: | 43.4% |
| Maryland: | 20.2% |


