Harrison, NY (New York) Houses and Residents
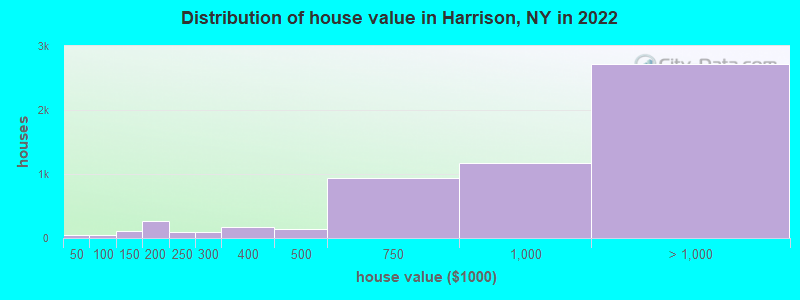
Estimated median house or condo value in 2022: $978,966 (it was $465,000 in 2000 )
Harrison:
$978,966New York:
$400,400
Lower value quartile - upper value quartile: $625,228 - Over $1,762,324Mean price in 2022: Detached houses: $1,576,151 Here:
$1,576,151State:
$476,719
Townhouses or other attached units: $648,698 Here:
$648,698State:
$699,270
In 2-unit structures: $721,836 Here:
$721,836State:
$713,077
In 3-to-4-unit structures: $258,184 Here:
$258,184State:
$764,568
In 5-or-more-unit structures: $309,255 Here:
$309,255State:
$912,009
Total population: 28,151 (Urban population: 22,600, Rural population: 1,543 (7 farm, 1,536 nonfarm ))
Houses: 8,977 (8,350 occupied: 5,595 owner occupied, 2,775 renter occupied )
% of renters here:
33%State:
46%
Housing density: 533 houses/condos per square mile
Median price asked for vacant for-sale houses and condos in 2022: $796,559.
Median contract rent in 2022: over $2,000 (lower quartile is $1,455, upper quartile is over $2,000)
Median rent asked for vacant for-rent units in 2022: $4,259
Median gross rent in Harrison, NY in 2022: over $2,000
Housing units in Harrison with a mortgage: 3,471 (431 second mortgage, 17 home equity loan, 383 both second mortgage and home equity loan )Houses without a mortgage: 87
Median household income for houses/condos with a mortgage: $227,707
Median household income for apartments without a mortgage: $134,842
Median monthly housing costs: $3,185
Data:
Median house or condo value ($)
Median house or condo value ($ change since 2000)
Median house or condo value ($) - White
Median house or condo value ($) - Black or African American
Median house or condo value ($) - Asian
Median house or condo value ($) - Hispanic or Latino
Median house or condo value ($) - American Indian and Alaska Native
Median house or condo value ($) - Multirace
Median house or condo value ($) - Other Race
Median price asked for mobile homes ($)
Household density (households per square mile)
Mean house or condo value by units in structure - 1, detached ($)
Mean house or condo value by units in structure - 1, attached ($)
Mean house or condo value by units in structure - 2 ($)
Mean house or condo value by units in structure by units in structure - 3 or 4 ($)
Mean house or condo value by units in structure - 5 or more ($)
Mean house or condo value by units in structure - Boat, RV, van, etc. ($)
Mean house or condo value by units in structure - Mobile home ($)
Median contract rent ($)
Median contract rent - Lower quartile ($)
Median contract rent - Upper quartile ($)
Median gross rent ($)
Urban houses (%)
Rural houses (%)
Houses occupied (%)
Houses occupied (% change since 2000)
Houses owner occupied (%)
Houses owner occupied (% change since 2000)
Houses renter occupied (%)
Houses renter occupied (% change since 2000)
Vacant housing units - For rent (%)
Vacant housing units - For rent (% change since 2000)
Vacant housing units - For sale only (%)
Vacant housing units - For sale only (% change since 2000)
Vacant housing units - Rented or sold, not occupied (%)
Vacant housing units - Rented or sold, not occupied (% change since 2000)
Vacant housing units - For seasonal, recreational, or occasional use (%)
Vacant housing units - For seasonal, recreational, or occasional use (% change since 2000)
Vacant housing units - For migrant workers (%)
Vacant housing units - For migrant workers (% change since 2000)
Vacant housing units - Other vacant (%)
Vacant housing units - Other vacant (% change since 2000)
Median monthly housing costs ($)
Median household income for houses/condos with a mortgage ($)
Median household income for houses/condos without a mortgage ($)
Median household income ($)
Median household income ($) - White
Median household income ($) - Black or African American
Median household income ($) - Asian
Median household income ($) - Hispanic or Latino
Median household income ($) - American Indian and Alaska Native
Median household income ($) - Multirace
Median household income ($) - Other Race
Mortgage status - with mortgage (%)
Mortgage status - with second mortgage (%)
Mortgage status - with home equity loan (%)
Mortgage status - with both second mortgage and home equity loan (%)
Mortgage status - without a mortgage (%)
Median year house/condo built
Median year apartment built
Household type by relationship - Male householder living alone (%)
Household type by relationship - Male householder not living alone (%)
Household type by relationship - Female householder living alone (%)
Household type by relationship - Female householder not living alone (%)
Household type by relationship - Opposite-Sex spouse (%)
Household type by relationship - Same-Sex spouse (%)
Household type by relationship - Opposite-Sex unmarried partner (%)
Household type by relationship - Same-Sex unmarried partner (%)
Household type by relationship - In group quarters (%)
Size of family households - 2-person household (%)
Size of family households - 3-person household (%)
Size of family households - 4-person household (%)
Size of family households - 5-person household (%)
Size of family households - 6-person household (%)
Size of family households - 7-or-more-person household (%)
Size of nonfamily households - 1-person household (%)
Size of nonfamily households - 2-person household (%)
Size of nonfamily households - 3-person household (%)
Size of nonfamily households - 4-person household (%)
Size of nonfamily households - 5-person household (%)
Size of nonfamily households - 6-person household (%)
Size of nonfamily households - 7-or-moreperson household (%)
Year house built - Built 2010 or later (%)
Year house built - Built 2000 to 2009 (%)
Year house built - Built 1990 to 1999 (%)
Year house built - Built 1980 to 1989 (%)
Year house built - Built 1970 to 1979 (%)
Year house built - Built 1960 to 1969 (%)
Year house built - Built 1950 to 1959 (%)
Year house built - Built 1940 to 1949 (%)
Year house built - Built 1939 or earlier (%)
Median number of rooms in houses and condos
Median number of rooms in apartments
Median number of bedrooms in owner occupied houses
Mean number of bedrooms in owner occupied houses
Median number of bedrooms in renter occupied houses
Mean number of bedrooms in renter occupied houses
Median number of vehichles in owner occupied houses
Mean number of vehichles in owner occupied houses
Median number of vehichles in renter occupied houses
Mean number of vehichles in renter occupied houses
Rooms in owner-occupied houses - 1 room (%)
Rooms in owner-occupied houses - 2 rooms (%)
Rooms in owner-occupied houses - 3 rooms (%)
Rooms in owner-occupied houses - 4 rooms (%)
Rooms in owner-occupied houses - 5 rooms (%)
Rooms in owner-occupied houses - 6 rooms (%)
Rooms in owner-occupied houses - 7 rooms (%)
Rooms in owner-occupied houses - 8 rooms (%)
Rooms in owner-occupied houses - 9+ rooms (%)
Rooms in renter-occupied houses - 1 room (%)
Rooms in renter-occupied houses - 2 rooms (%)
Rooms in renter-occupied houses - 3 rooms (%)
Rooms in renter-occupied houses - 4 rooms (%)
Rooms in renter-occupied houses - 5 rooms (%)
Rooms in renter-occupied houses - 6 rooms (%)
Rooms in renter-occupied houses - 7 rooms (%)
Rooms in renter-occupied houses - 8 rooms (%)
Rooms in renter-occupied houses - 9+ rooms (%)
Bedrooms in owner-occupied houses - no bedrooms (%)
Bedrooms in owner-occupied houses - 1 bedroom (%)
Bedrooms in owner-occupied houses - 2 bedrooms (%)
Bedrooms in owner-occupied houses - 3 bedrooms (%)
Bedrooms in owner-occupied houses - 4 bedrooms (%)
Bedrooms in owner-occupied houses - 5+ bedrooms (%)
Bedrooms in renter-occupied houses - no bedrooms (%)
Bedrooms in renter-occupied houses - 1 bedroom (%)
Bedrooms in renter-occupied houses - 2 bedrooms (%)
Bedrooms in renter-occupied houses - 3 bedrooms (%)
Bedrooms in renter-occupied houses - 4 bedrooms (%)
Bedrooms in renter-occupied houses - 5+ bedrooms (%)
Vehicles available in owner-occupied houses - no vehicle available (%)
Vehicles available in owner-occupied houses - 1 vehicle available(%)
Vehicles available in owner-occupied houses - 2 Vehicles available (%)
Vehicles available in owner-occupied houses - 3 Vehicles available (%)
Vehicles available in owner-occupied houses - 4 Vehicles available (%)
Vehicles available in owner-occupied houses - 5+ Vehicles available (%)
Vehicles available in renter-occupied houses - no vehicle available (%)
Vehicles available in renter-occupied houses - 1 vehicle available (%)
Vehicles available in renter-occupied houses - 2 Vehicles available (%)
Vehicles available in renter-occupied houses - 3 Vehicles available (%)
Vehicles available in renter-occupied houses - 4 Vehicles available (%)
Vehicles available in renter-occupied houses - 5+ Vehicles available (%)
Housing units in structures - 1, detached (%)
Housing units in structures - 1, attached (%)
Housing units in structures - 2 (%)
Housing units in structures - 3 or 4 (%)
Housing units in structures - 5 to 9 (%)
Housing units in structures - 10 to 19 (%)
Housing units in structures - 20 to 49 (%)
Housing units in structures - 50 or more (%)
Housing units in structures - Mobile home (%)
Housing units in structures - Boat, RV, van, etc. (%)
Housing units in structures - Owners - 1, detached (%)
Housing units in structures - Owners - 1, attached (%)
Housing units in structures - Owners - 2 (%)
Housing units in structures - Owners - 3 or 4 (%)
Housing units in structures - Owners - 5 to 9 (%)
Housing units in structures - Owners - 10 to 19 (%)
Housing units in structures - Owners - 20 to 49 (%)
Housing units in structures - Owners - 50 or more (%)
Housing units in structures - Owners - Mobile home (%)
Housing units in structures - Owners - Boat, RV, van, etc. (%)
Housing units in structures - Renters - 1, detached (%)
Housing units in structures - Renters - 1, attached (%)
Housing units in structures - Renters - 2 (%)
Housing units in structures - Renters - 3 or 4 (%)
Housing units in structures - Renters - 5 to 9 (%)
Housing units in structures - Renters - 10 to 19 (%)
Housing units in structures - Renters - 20 to 49 (%)
Housing units in structures - Renters - 50 or more (%)
Housing units in structures - Renters - Mobile home (%)
Housing units in structures - Renters - Boat, RV, van, etc. (%)
House/condo owner moved in on average (years ago)
Renter moved in on average (years ago)
Year householder moved into unit - Moved in 1999 to March 2000 (%)
Year householder moved into unit - Moved in 1999 to March 2000 (%) - White
Year householder moved into unit - Moved in 1999 to March 2000 (%) - Black or African American
Year householder moved into unit - Moved in 1999 to March 2000 (%) - Asian
Year householder moved into unit - Moved in 1999 to March 2000 (%) - Hispanic or Latino
Year householder moved into unit - Moved in 1999 to March 2000 (%) - American Indian and Alaska Native
Year householder moved into unit - Moved in 1999 to March 2000 (%) - Multirace
Year householder moved into unit - Moved in 1999 to March 2000 (%) - Other Race
Year householder moved into unit - Moved in 1995 to 1998 (%)
Year householder moved into unit - Moved in 1995 to 1998 (%) - White
Year householder moved into unit - Moved in 1995 to 1998 (%) - Black or African American
Year householder moved into unit - Moved in 1995 to 1998 (%) - Asian
Year householder moved into unit - Moved in 1995 to 1998 (%) - Hispanic or Latino
Year householder moved into unit - Moved in 1995 to 1998 (%) - American Indian and Alaska Native
Year householder moved into unit - Moved in 1995 to 1998 (%) - Multirace
Year householder moved into unit - Moved in 1995 to 1998 (%) - Other Race
Year householder moved into unit - Moved in 1990 to 1994 (%)
Year householder moved into unit - Moved in 1990 to 1994 (%) - White
Year householder moved into unit - Moved in 1990 to 1994 (%) - Black or African American
Year householder moved into unit - Moved in 1990 to 1994 (%) - Asian
Year householder moved into unit - Moved in 1990 to 1994 (%) - Hispanic or Latino
Year householder moved into unit - Moved in 1990 to 1994 (%) - American Indian and Alaska Native
Year householder moved into unit - Moved in 1990 to 1994 (%) - Multirace
Year householder moved into unit - Moved in 1990 to 1994 (%) - Other Race
Year householder moved into unit - Moved in 1980 to 1989 (%)
Year householder moved into unit - Moved in 1980 to 1989 (%) - White
Year householder moved into unit - Moved in 1980 to 1989 (%) - Black or African American
Year householder moved into unit - Moved in 1980 to 1989 (%) - Asian
Year householder moved into unit - Moved in 1980 to 1989 (%) - Hispanic or Latino
Year householder moved into unit - Moved in 1980 to 1989 (%) - American Indian and Alaska Native
Year householder moved into unit - Moved in 1980 to 1989 (%) - Multirace
Year householder moved into unit - Moved in 1980 to 1989 (%) - Other Race
Year householder moved into unit - Moved in 1970 to 1979 (%)
Year householder moved into unit - Moved in 1970 to 1979 (%) - White
Year householder moved into unit - Moved in 1970 to 1979 (%) - Black or African American
Year householder moved into unit - Moved in 1970 to 1979 (%) - Asian
Year householder moved into unit - Moved in 1970 to 1979 (%) - Hispanic or Latino
Year householder moved into unit - Moved in 1970 to 1979 (%) - American Indian and Alaska Native
Year householder moved into unit - Moved in 1970 to 1979 (%) - Multirace
Year householder moved into unit - Moved in 1970 to 1979 (%) - Other Race
Year householder moved into unit - Moved in 1969 or earlier (%)
Year householder moved into unit - Moved in 1969 or earlier (%) - White
Year householder moved into unit - Moved in 1969 or earlier (%) - Black or African American
Year householder moved into unit - Moved in 1969 or earlier (%) - Asian
Year householder moved into unit - Moved in 1969 or earlier (%) - Hispanic or Latino
Year householder moved into unit - Moved in 1969 or earlier (%) - American Indian and Alaska Native
Year householder moved into unit - Moved in 1969 or earlier (%) - Multirace
Year householder moved into unit - Moved in 1969 or earlier (%) - Other Race
Housing units lacking complete plumbing facilities (%)
Housing units lacking complete kitchen facilities (%)
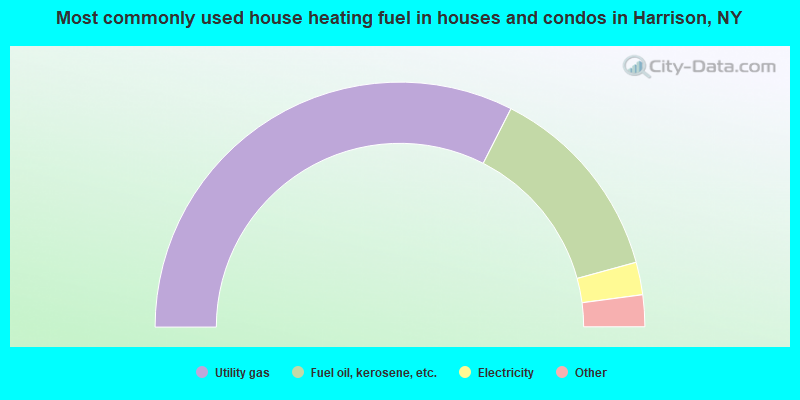
House heating fuel used in houses and condos - Utility gas (%)
House heating fuel used in houses and condos - Bottled, tank, or LP gas (%)
House heating fuel used in houses and condos - Electricity (%)
House heating fuel used in houses and condos - Fuel oil, kerosene, etc. (%)
House heating fuel used in houses and condos - Coal or coke (%)
House heating fuel used in houses and condos - Wood (%)
House heating fuel used in houses and condos - Solar energy (%)
House heating fuel used in houses and condos - Other fuel (%)
House heating fuel used in houses and condos - No fuel used (%)
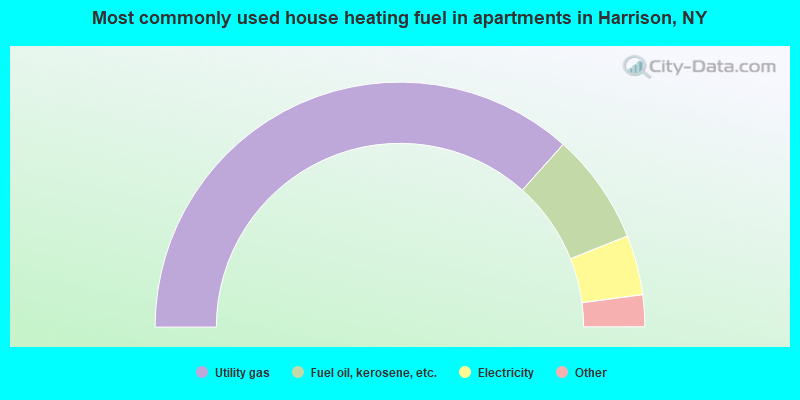
House heating fuel used in apartments - Utility gas (%)
House heating fuel used in apartments - Bottled, tank, or LP gas (%)
House heating fuel used in apartments - Electricity (%)
House heating fuel used in apartments - Fuel oil, kerosene, etc. (%)
House heating fuel used in apartments - Coal or coke (%)
House heating fuel used in apartments - Wood (%)
House heating fuel used in apartments - Solar energy (%)
House heating fuel used in apartments - Other fuel (%)
House heating fuel used in apartments - No fuel used (%)
Latest news about housing in Harrison, NY collected exclusively by city-data.com from local newspapers, TV, and radio stations
Median year house/condo built: 1963Median year apartment built: 1964Household type by relationship:
Households: 28,505
Male householders: 4,236 (483 living alone ), Female householders: 3,944 (869 living alone )5,245 spouses (5,217 opposite-sex spouses ), 462 unmarried partners , (462 opposite-sex unmarried partners ), 9,209 children (8,970 natural , 157 adopted , 81 stepchildren ), 538 grandchildren , 67 brothers or sisters , 173 parents , 0 foster children , 327 other relatives , 920 non-relatives In group quarters: 3,380
Size of family households: 1,959 2-persons , 1,192 3-persons , 2,001 4-persons , 917 5-persons , 235 6-persons , 58 7-or-more-persons .
Size of nonfamily households: 1,470 1-person , 310 2-persons , 77 3-persons , 45 4-persons .
5,661 married couples with children. single-parent households (315 men , 423 women ).
70.5% of residents of Harrison speak English at home. of residents speak Spanish at home (73% speak English very well , 20% speak English well , 7% speak English not well ).of residents speak other Indo-European language at home (73% speak English very well , 24% speak English well , 3% speak English not well ).of residents speak Asian or Pacific Island language at home (39% speak English very well , 32% speak English well , 28% speak English not well , 1% don't speak English at all ).of residents speak other language at home (97% speak English very well , 3% speak English well ).
Foreign born population: 6,003 (21.1%)of them are naturalized citizens )
Median number of rooms in houses and condos:
Median number of rooms in apartments
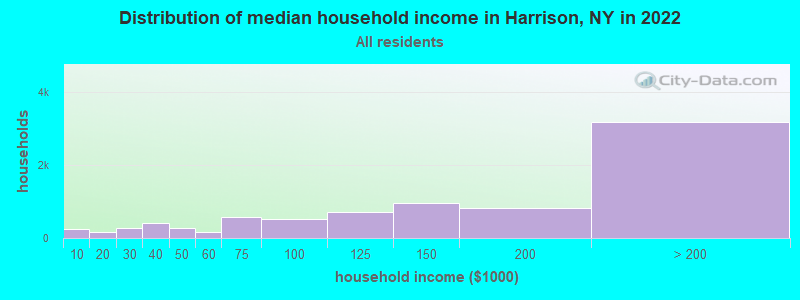
Harrison, NY household income distribution 257 Less than $10,000156 $10,000 to $19,999268 $20,000 to $29,999408 $30,000 to $39,999260 $40,000 to $49,999156 $50,000 to $59,999587 $60,000 to $74,999511 $75,000 to $99,999706 $100,000 to $124,999951 $125,000 to $149,999827 $150,000 to $199,9993,169 $200,000 or more
Home value of owner - occupied houses in 2022 in Harrison, NY 53 Less than $10,00022 $50,000 to $59,99912 $70,000 to $79,9996 $80,000 to $89,99950 $100,000 to $124,99961 $125,000 to $149,99989 $150,000 to $174,999175 $175,000 to $199,99997 $200,000 to $249,99989 $250,000 to $299,999174 $300,000 to $399,999136 $400,000 to $499,999934 $500,000 to $749,9991,177 $750,000 to $999,999916 $1,000,000 to $1,499,999612 $1,500,000 to $1,999,9991,197 $2,000,000 or moreRent paid by renters in 2022 in Harrison, NY 43 $200 to $2493 $550 to $59925 $650 to $69948 $700 to $74926 $900 to $999242 $1,000 to $1,249207 $1,250 to $1,499256 $1,500 to $1,999609 $2,000 to $2,499279 $2,500 to $2,999200 $3,000 to $3,499367 $3,500 or more315 No cash rent
Percentage of workers working in this county: 68.4%Number of people working at home: 2,880 (21.5% of all workers )
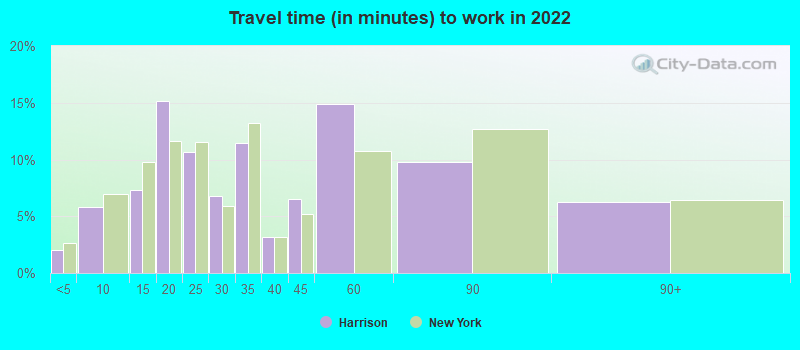
Travel time to work (commute)
Less than 5 minutes: 3215 to 9 minutes: 1,09310 to 14 minutes: 1,42715 to 19 minutes: 1,99920 to 24 minutes: 90925 to 29 minutes: 65030 to 34 minutes: 63135 to 39 minutes: 21040 to 44 minutes: 38745 to 59 minutes: 77060 to 89 minutes: 1,84490 or more minutes: 380
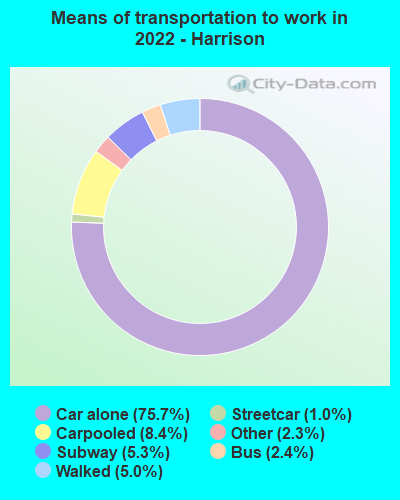
Means of transportation to work:
Drove a car alone: 14,592 (64.3%)Carpooled: 1,635 (7.2%)Bus : 397 (1.7%)Subway or elevated rail : 245 (1.1%)Long-distance train or commuter rail : 767 (3.4%)Taxi: 762 (3.4%)Walked: 968 (4.3%)Worked at home: 2,880 (12.7%)
Unemployment by race in 2022
Unemployment rate for White non-Hispanic residents 2.7% Males4.6% FemalesUnemployment rate for Black residents 6.6% MalesUnemployment rate for Asian residents 9.0% Males8.4% FemalesUnemployment rate for other race residents 1.4% Males4.0% FemalesUnemployment rate for two or more race residents 0.2% MalesUnemployment rate for Hispanic or Latino residents 0.7% Males5.6% Females
Year of entry for the foreign-born population in Harrison, New York
2,561 2010 or later 1,181 2000 to 2009 944 1990 to 1999 643 1980 to 1989 682 1970 to 1979 1,320 Before 1970
First ancestries reported:
Italian: 4,763 (31.5%)
American: 1,246 (8.2%)
Irish: 741 (4.9%)
Eastern European: 430 (2.8%)
European: 428 (2.8%)
Brazilian: 300 (2.0%)
German: 286 (1.9%)
Nigerian: 231 (1.5%)
English: 228 (1.5%)
Ethiopian: 217 (1.4%)
French: 205 (1.4%)
Iranian: 135 (0.9%)
Albanian: 131 (0.9%)
Russian: 122 (0.8%)
Polish: 114 (0.8%)
Greek: 87 (0.6%)
Jamaican: 76 (0.5%)
French Canadian: 73 (0.5%)
Guyanese: 64 (0.4%)
South African: 52 (0.3%)
Hungarian: 49 (0.3%)
Ukrainian: 47 (0.3%)
Scottish: 45 (0.3%)
British West Indian: 41 (0.3%)
Turkish: 40 (0.3%)
Israeli: 37 (0.2%)
Trinidadian and Tobagonian: 36 (0.2%)
Portuguese: 35 (0.2%)
Haitian: 33 (0.2%)
Lebanese: 26 (0.2%)
Canadian: 25 (0.2%)
Armenian: 16 (0.1%)
Dutch: 14 (0.09%)
Norwegian: 14 (0.09%)
Egyptian: 13 (0.09%)
Iraqi: 11 (0.07%)
British: 11 (0.07%)
Australian: 10 (0.07%)
Palestinian: 10 (0.07%)
Scandinavian: 9 (0.06%)
Austrian: 9 (0.06%)
Serbian: 9 (0.06%)
Latvian: 9 (0.06%)
Macedonian: 8 (0.05%)
Belizean: 8 (0.05%)
Czech: 8 (0.05%)
Ghanaian: 6 (0.04%)
Northern European: 6 (0.04%)
Slovene: 6 (0.04%)
Icelander: 4 (0.03%)
Lithuanian: 4 (0.03%)
African: 4 (0.03%)
Barbadian: 4 (0.03%)
Yugoslavian: 4 (0.03%)
Danish: 3 (0.02%)
Croatian: 3 (0.02%)
Romanian: 3 (0.02%)
Celtic: 2 (0.01%)
Most common places of birth for foreign-born residents (%): Japan Harrison:
12.4% (735)New York:
0.6% (28,472)
Brazil Harrison:
10.1% (602)New York:
0.7% (30,658)
Italy Harrison:
9.3% (554)New York:
1.8% (81,374)
Mexico Harrison:
5.3% (314)New York:
4.8% (214,559)
Argentina Harrison:
4.4% (262)New York:
0.5% (21,928)
Nigeria Harrison:
4.2% (251)New York:
0.7% (33,746)
Ethiopia Harrison:
4.2% (251)New York:
0.1% (6,029)
China, excluding Hong Kong and Taiwan Harrison:
3.9% (231)New York:
9.1% (410,910)
Ecuador Harrison:
3.7% (221)New York:
3.9% (177,448)
Colombia Harrison:
3.6% (215)New York:
2.5% (111,920)
Canada Harrison:
3.2% (190)New York:
1.3% (59,107)
France Harrison:
2.7% (162)New York:
0.6% (25,782)
Guatemala Harrison:
2.6% (154)New York:
1.4% (61,245)
Dominican Republic Harrison:
2.4% (142)New York:
11.1% (501,040)
Philippines Harrison:
2.3% (138)New York:
2.0% (91,070)
Nepal Harrison:
1.7% (100)New York:
0.4% (17,363)
Spain Harrison:
1.7% (99)New York:
0.3% (14,949)
United Kingdom, excluding England and Scotland Harrison:
1.5% (92)New York:
0.8% (33,869)
Israel Harrison:
1.5% (90)New York:
0.7% (29,743)
Place of birth for U.S.-born residents:
This state: 15,800Other state: 6,199Northeast: 3,935Midwest: 788South: 997West: 364 87.2% of Harrison residents lived in the same house 1 years ago.
Out of people who lived in different houses, 27.4% lived in this county.
Out of people who lived in different counties, 60.4% lived in New York.
Harrison:
87.2%State average:
89.6%
Education attainment for males 25 years and older:
No schooling: 49Nursery to 4th grade: 185th and 6th grade: 597th and 8th grade: 679th grade: 4410th grade: 2311th grade: 12512th grade, no diploma: 156High school graduate (or equivalency): 1,062Less than 1 year of college: 189Some college more than 1 year, no degree: 756Associate degree: 646Bachelor's degree: 2,845Master's degree: 1,097Professional school degree: 725Doctorate degree: 163
Education attainment for females 25 years and older:
No schooling: 62Nursery to 4th grade: 135th and 6th grade: 537th and 8th grade: 09th grade: 8010th grade: 2211th grade: 4012th grade, no diploma: 70High school graduate (or equivalency): 1,414Less than 1 year of college: 549Some college more than 1 year, no degree: 544Associate degree: 732Bachelor's degree: 3,292Master's degree: 1,512Professional school degree: 345Doctorate degree: 89
Housing units in structures:
One, detached: 4,826One, attached: 561Two: 1,9503 or 4: 6565 to 9: 12510 to 19: 10720 to 49: 15050 or more: 598Housing units lacking complete kitchen facilities in 2022: 0.1%House/condo owner moved in on average 13 years ago
Renter moved in on average 3 years ago
Private vs. public school enrollment:
Students in private schools in grades 1 to 8 (elementary and middle school): 766 Students in private schools in grades 9 to 12 (high school): 445 Students in private undergraduate colleges: 3,161