Jump to a detailed profile or search site with Google Custom Search

Foothill Ranch, CA (California) Houses and Residents

Estimated median house or condo value in 2022: $1,163,295 (it was $312,800 in 2000)
Foothill Ranch:

$1,163,295
California:

$715,900
Lower value quartile - upper value quartile: $879,232 - $1,270,534

Total population: 11,286 (Urban population: 10,907, Rural population: 0)

Houses: 3,900 (3,844 occupied: 2,945 owner occupied, 899 renter occupied)

% of renters here:

23%
State:

44%

Housing density: 1,381 houses/condos per square mile

Median price asked for vacant for-sale houses and condos in 2022 in this county: $1,279,555.

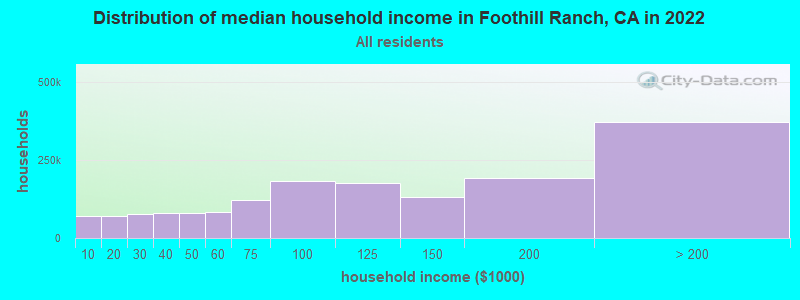
Median contract rent in 2022: over $2,000 (lower quartile is over $2,000, upper quartile is over $2,000)


Median rent asked for vacant for-rent units in 2022: $2,818


Median gross rent in Foothill Ranch, CA in 2022: over $2,000

Housing units in Foothill Ranch with a mortgage: 2,715 (532 second mortgage, 306 home equity loan, 11 both second mortgage and home equity loan)
Houses without a mortgage: 44

Compare current foreclosures near Foothill Ranch, CA:

Check out more offers near Foothill Ranch, CA.
Powered by Foreclosure.com


Foothill Ranch, California Age and Sex of Residents

Household type by relationship:

Households: 2,970,996
  • In family households: 2,574,637 (510,612 male householders, 197,879 female householders)
    538,268 spouses, 917,395 children (868,578 natural, 16,498 adopted, 32,319 stepchildren), 67,543 grandchildren, 54,495 brothers or sisters, 47,670 parents, foster children, 85,984 other relatives, 117,563 non-relatives
  • In nonfamily households: 396,359 (130,596 male householders (87,348 living alone)), 153,694 female householders (120,501 living alone)), 112,069 nonrelatives
  • In group quarters: 39,236 (14,531 institutionalized population)

546,370 married couples with children.
125,951 single-parent households (34,925 men, 91,026 women).

75.4% of residents of Foothill Ranch speak English at home.
7.1% of residents speak Spanish at home (71% speak English very well, 23% speak English well, 4% speak English not well, 1% don't speak English at all).
3.5% of residents speak other Indo-European language at home (86% speak English very well, 11% speak English well, 3% don't speak English at all).
13.0% of residents speak Asian or Pacific Island language at home (56% speak English very well, 27% speak English well, 17% speak English not well).
1.0% of residents speak other language at home (56% speak English very well, 44% speak English well).

Foreign born population: 2,132 (17.7%)
(78.2% of them are naturalized citizens)

Median number of rooms in houses and condos:
Here:

6.1
State:

6.0

Median number of rooms in apartments
Here:

3.9
State:

3.9

Owner-occupied Renter-occupied
Bedrooms in owner-occupied houses and condos in Foothill Ranch, California
  • Bedrooms in owner-occupied houses and condos in Foothill Ranch, California
  • 30no bedroom
  • 701 bedroom
  • 4182 bedrooms
  • 1,0453 bedrooms
  • 1,1914 bedrooms
  • 1915+ bedrooms
Bedrooms in renter-occupied apartments in Foothill Ranch, California
  • Bedrooms in renter-occupied apartments in Foothill Ranch, California
  • 31no bedroom
  • 4131 bedroom
  • 3642 bedrooms
  • 603 bedrooms
  • 244 bedrooms
  • 75+ bedrooms
Owner-occupied Renter-occupied
Cars and other vehicles available in Foothill Ranch in owner-occupied houses/condos
  • Cars and other vehicles available in Foothill Ranch in owner-occupied houses/condos
  • 64no vehicle
  • 4081 vehicle
  • 2,0982 vehicles
  • 3153 vehicles
  • 604 vehicles
  • 05+ vehicles
Cars and other vehicles available in Foothill Ranch in renter-occupied apartments
  • Cars and other vehicles available in Foothill Ranch in renter-occupied apartments
  • 0no vehicle
  • 4491 vehicle
  • 3502 vehicles
  • 903 vehicles
  • 104 vehicles
  • 05+ vehicles
Owner-occupied Renter-occupied
Rooms in owner-occupied houses in Foothill Ranch, California
  • Rooms in owner-occupied houses in Foothill Ranch, California
  • 91 room
  • 532 rooms
  • 1943 rooms
  • 1294 rooms
  • 3695 rooms
  • 5596 rooms
  • 6477 rooms
  • 5438 rooms
  • 4429+ rooms
Rooms in renter-occupied apartments in Foothill Ranch, California
  • Rooms in renter-occupied apartments in Foothill Ranch, California
  • 311 room
  • 1422 rooms
  • 2663 rooms
  • 2654 rooms
  • 1465 rooms
  • 96 rooms
  • 247 rooms
  • 98 rooms
  • 79+ rooms
Year house built
Breakdown of mean house values by ages of householders
Owners and renters by unit type in Foothill Ranch, CA
  • Foothill Ranch, CA household income distribution

  • Distribution of median household income in Foothill Ranch, CA in 2022
  • 70,104Less than $10,000
  • 71,950$10,000 to $19,999
  • 78,157$20,000 to $29,999
  • 79,366$30,000 to $39,999
  • 78,924$40,000 to $49,999
  • 83,487$50,000 to $59,999
  • 121,179$60,000 to $74,999
  • 183,810$75,000 to $99,999
  • 177,885$100,000 to $124,999
  • 132,877$125,000 to $149,999
  • 193,074$150,000 to $199,999
  • 371,931$200,000 or more

Percentage of workers working in this county: 91.3%
Number of people working at home: 1,273 (17.8% of all workers)

Travel time to work (commute)

  • Less than 5 minutes: 111
  • 5 to 9 minutes: 315
  • 10 to 14 minutes: 475
  • 15 to 19 minutes: 672
  • 20 to 24 minutes: 722
  • 25 to 29 minutes: 559
  • 30 to 34 minutes: 1,155
  • 35 to 39 minutes: 245
  • 40 to 44 minutes: 327
  • 45 to 59 minutes: 411
  • 60 to 89 minutes: 437
  • 90 or more minutes: 246

Means of transportation to work:

  • Drove a car alone: 5,140 (86.7%)
  • Carpooled: 467 (7.9%)
  • Bus or trolley bus: 13 (0.2%)
  • Railroad: 10 (0.2%)
  • Motorcycle: 30 (0.5%)
  • Other means: 15 (0.3%)
  • Worked at home: 255 (4.3%)
Class of Workers in 2000
Year of entry for the foreign-born population in Foothill Ranch, California
  • Year of entry for the foreign-born population in Foothill Ranch, California
  • 3831995 to March 2000
  • 3121990 to 1994
  • 2031985 to 1989
  • 3841980 to 1984
  • 2241975 to 1979
  • 1851970 to 1974
  • 1341965 to 1969
  • 77Before 1965
Ancestries in Foothill Ranch, CA <small>(Other ancestries excluded from the graph)</small>

First ancestries reported:

  • Other: 4,484 (33.3%)
  • German: 1,883 (14.0%)
  • English: 1,532 (11.4%)
  • Irish: 1,380 (10.3%)
  • Italian: 866 (6.4%)
  • French: 528 (3.9%)
  • Swedish: 370 (2.8%)
  • United States: 347 (2.6%)
  • Polish: 268 (2.0%)
  • Norwegian: 241 (1.8%)
  • Arab: 221 (1.6%)
  • Russian: 212 (1.6%)
  • Scotch-Irish: 212 (1.6%)
  • Dutch: 206 (1.5%)
  • Scottish: 175 (1.3%)
  • Lithuanian: 99 (0.7%)
  • Greek: 86 (0.6%)
  • Welsh: 70 (0.5%)
  • Danish: 64 (0.5%)
  • Swiss: 49 (0.4%)
  • Hungarian: 41 (0.3%)
  • Czech: 28 (0.2%)
  • Portuguese: 28 (0.2%)
  • French Canadian: 23 (0.2%)
  • Ukrainian: 21 (0.2%)
  • Subsaharan African: 19 (0.1%)

Most common places of birth for foreign-born residents (%):

Philippines
Foothill Ranch:

18.8% (357)
California:

7.5% (664,935)

Taiwan
Foothill Ranch:

9.2% (175)
California:

1.7% (151,775)

Korea
Foothill Ranch:

6.7% (128)
California:

3.0% (268,452)

Mexico
Foothill Ranch:

6.4% (121)
California:

44.3% (3,928,701)

Vietnam
Foothill Ranch:

6.0% (115)
California:

4.7% (418,249)

Hong Kong
Foothill Ranch:

5.5% (104)
California:

1.0% (91,101)

Iran
Foothill Ranch:

4.9% (94)
California:

1.8% (158,613)

Germany
Foothill Ranch:

4.8% (92)
California:

1.1% (98,160)

China, excluding Hong Kong and Taiwan
Foothill Ranch:

4.4% (83)
California:

3.7% (327,611)

Canada
Foothill Ranch:

4.3% (82)
California:

1.6% (141,181)

United Kingdom
Foothill Ranch:

4.3% (81)
California:

1.5% (133,090)

Italy
Foothill Ranch:

2.4% (45)
California:

0.4% (38,450)

Iraq
Foothill Ranch:

2.2% (42)
California:

0.2% (20,532)

Japan
Foothill Ranch:

2.0% (38)
California:

1.3% (112,212)

El Salvador
Foothill Ranch:

1.8% (34)
California:

4.1% (359,673)

Argentina
Foothill Ranch:

1.8% (34)
California:

0.3% (29,335)

South Africa
Foothill Ranch:

1.5% (29)
California:

0.2% (14,359)

Place of birth for U.S.-born residents:

  • This state: 5,783
  • Other state: 3,107
  • Northeast: 815
  • Midwest: 1,062
  • South: 663
  • West: 567

36% of Foothill Ranch residents lived in the same house 5 years ago.
   Out of people who lived in different houses, 59% lived in this county.
   Out of people who lived in different counties, 53% lived in California.

Education attainment for males 25 years and older:

  • No schooling: 0
  • Nursery to 4th grade: 0
  • 5th and 6th grade: 0
  • 7th and 8th grade: 0
  • 9th grade: 8
  • 10th grade: 0
  • 11th grade: 24
  • 12th grade, no diploma: 76
  • High school graduate (or equivalency): 225
  • Less than 1 year of college: 204
  • Some college more than 1 year, no degree: 650
  • Associate degree: 279
  • Bachelor's degree: 1,344
  • Master's degree: 396
  • Professional school degree: 84
  • Doctorate degree: 52
Educational Attainment for Males

Education attainment for females 25 years and older:

  • No schooling: 7
  • Nursery to 4th grade: 0
  • 5th and 6th grade: 21
  • 7th and 8th grade: 9
  • 9th grade: 24
  • 10th grade: 0
  • 11th grade: 16
  • 12th grade, no diploma: 35
  • High school graduate (or equivalency): 446
  • Less than 1 year of college: 411
  • Some college more than 1 year, no degree: 703
  • Associate degree: 370
  • Bachelor's degree: 1,272
  • Master's degree: 267
  • Professional school degree: 62
  • Doctorate degree: 0
Educational Attainment for Females
Foothill Ranch marital status for males
Foothill Ranch marital status for females

Housing units in structures:

  • One, detached: 2,574
  • One, attached: 389
  • Two: 54
  • 3 or 4: 159
  • 5 to 9: 231
  • 10 to 19: 229
  • 20 to 49: 134
  • 50 or more: 130
Year householders moved into residence in Foothill Ranch
Houses and condos Apartments
Most commonly used house heating fuel in houses and condos in Foothill Ranch, CA
  • 86.1%Utility gas
  • 12.3%Electricity
  • 1.5%Bottled, tank, or LP gas
Most commonly used house heating fuel in apartments in Foothill Ranch, CA
  • 61.8%Electricity
  • 38.2%Utility gas

Private vs. public school enrollment:

Students in private schools in grades 1 to 8 (elementary and middle school): 100
Here:

7.0%
California:

9.9%

Students in private schools in grades 9 to 12 (high school): 8
Here:

2.5%
California:

7.8%

Students in private undergraduate colleges: 109
Here:

19.9%
California:

15.4%
School Enrollment by Level of School for Male Students
School Enrollment by Level of School for Female Students
Age and Sex of Sensory-Disabled Noninstitutionalized Residents
Age and Sex of Physically-Disabled Noninstitutionalized Residents
Age and Sex of Mentally-Disabled Noninstitutionalized Residents
Age and Sex of Self-Care Disabled Noninstitutionalized Residents
Age and Sex of Go-Outside-Home Disabled Noninstitutionalized Residents
Age and Sex of Noninstitutionalized Residents with Employment Disability