Cupertino, CA (California) Houses and Residents
| Cupertino: | $2,241,040 |
| California: | $715,900 |
Mean price in 2022:
Detached houses: $2,928,336
Here: $2,928,336 State: $988,808 Townhouses or other attached units: $1,666,411
Here: $1,666,411 State: $838,546 In 2-unit structures: $1,234,759
Here: $1,234,759 State: $1,138,100 In 3-to-4-unit structures: $1,336,787
Here: $1,336,787 State: $824,253 In 5-or-more-unit structures: $1,222,146
Here: $1,222,146 State: $730,996
Total population: 60,668 (Urban population: 50,616, Rural population: 41 (all nonfarm))
Houses: 22,195 (21,007 occupied: 12,688 owner occupied, 8,250 renter occupied)
| % of renters here: | 39% |
| State: | 44% |
Housing density: 2,029 houses/condos per square mile
Median price asked for vacant for-sale houses and condos in 2022: $2,837,775.
Median contract rent in 2022: over $2,000 (lower quartile is over $2,000, upper quartile is over $2,000)
Median rent asked for vacant for-rent units in 2022: $4,574
Median gross rent in Cupertino, CA in 2022: over $2,000
Housing units in Cupertino with a mortgage: 7,155 (855 second mortgage, 33 home equity loan, 757 both second mortgage and home equity loan)
Houses without a mortgage: 190
Median household income for houses/condos with a mortgage: $253,538
Median household income for apartments without a mortgage: $170,556
Median monthly housing costs: $3,484
Compare current foreclosures near Cupertino, CA:
| Photo | Address | Area | Beds / Baths | Price | Details |
|---|---|---|---|---|---|

|
#1
S Blaney Ave
Cupertino, CA 95014
|
1,567 sq. feet
|
2 baths 3 beds |
show details | |

|
#2
Gascoigne Dr
Cupertino, CA 95014
|
3,634 sq. feet
|
3 baths 5 beds |
show details | |

|
#3
Majestic Oak Way
Cupertino, CA 95014
|
1,017 sq. feet
|
2 baths 2 beds |
show details | |

|
#4
La Mar Dr
Cupertino, CA 95014
|
1,374 sq. feet
|
2 baths 3 beds |
show details | |

|
#5
Oak Valley Rd
Cupertino, CA 95014
|
3,350 sq. feet
|
3 baths 5 beds |
show details | |

|
#6
Stevens Creek Blvd Unit 2610
Cupertino, CA 95015
|
- sq. feet
|
- baths - beds |
show details | |

|
#7
Bianchi Way Apt 114
Cupertino, CA 95014
|
- sq. feet
|
- baths - beds |
show details | |

|
#8
Stonegate Cir
San Jose, CA 95110
|
468 sq. feet
|
1 baths 1 beds |
$479,900
|
show details |

|
#9
San Vicente Ter
Santa Cruz, CA 95060
|
- sq. feet
|
1 baths 2 beds |
$220,000
|
show details |

|
#10
Fan St
San Jose, CA 95131
|
2,009 sq. feet
|
3 baths 4 beds |
show details |
| Photo | Address | Area | Beds / Baths | Price | Details |
|---|---|---|---|---|---|

|
#11
Sierra Meadow Dr
San Jose, CA 95116
|
1,091 sq. feet
|
2 baths 3 beds |
show details | |

|
#12
Kings River Ct
San Jose, CA 95136
|
1,104 sq. feet
|
2 baths 3 beds |
show details | |

|
#13
Nicasio Ct
San Jose, CA 95127
|
2,000 sq. feet
|
2 baths 4 beds |
show details | |

|
#14
Larkspur Dr
Palo Alto, CA 94303
|
1,700 sq. feet
|
2 baths 3 beds |
show details | |

|
#15
Mia Cir
San Jose, CA 95136
|
2,236 sq. feet
|
3 baths 5 beds |
show details | |

|
#16
Larkspur Dr
Palo Alto, CA 94303
|
840 sq. feet
|
1 baths 2 beds |
show details | |

|
#17
Taji Ct
San Jose, CA 95122
|
2,109 sq. feet
|
3 baths 6 beds |
show details | |

|
#18
Sheridan Pl
San Jose, CA 95111
|
1,132 sq. feet
|
2 baths 3 beds |
show details | |

|
#19
Salmon Dr
San Jose, CA 95111
|
1,230 sq. feet
|
2 baths 4 beds |
show details | |

|
#20
Grecia Ct
San Jose, CA 95116
|
1,180 sq. feet
|
1 baths 3 beds |
show details |
| Photo | Address | Area | Beds / Baths | Price | Details |
|---|---|---|---|---|---|

|
#21
Garden St Unit 21
Milpitas, CA 95035
|
1,072 sq. feet
|
2 baths 1 beds |
show details | |

|
#22
Bluejacket Way
San Jose, CA 95133
|
2,124 sq. feet
|
3 baths 4 beds |
show details | |

|
#23
Gilchrist Dr Apt 3
San Jose, CA 95133
|
903 sq. feet
|
1 baths 2 beds |
show details | |

|
#24
Parc Place Dr
Milpitas, CA 95035
|
1,038 sq. feet
|
3 baths 2 beds |
show details | |

|
#25
E San Fernando St
San Jose, CA 95116
|
1,155 sq. feet
|
1 baths 2 beds |
show details | |

|
#26
Esfahan Dr
San Jose, CA 95111
|
1,607 sq. feet
|
2 baths 3 beds |
show details | |

|
#27
Voss Park Ln
San Jose, CA 95131
|
1,320 sq. feet
|
2 baths 4 beds |
show details | |

|
#28
Kyburz Pl
San Jose, CA 95120
|
2,787 sq. feet
|
2 baths 3 beds |
show details | |

|
#29
Pine Hollow Cir
San Jose, CA 95133
|
1,625 sq. feet
|
2 baths 5 beds |
show details | |

|
#30
Ensign Way
San Jose, CA 95133
|
2,941 sq. feet
|
2 baths 4 beds |
show details |
| Photo | Address | Area | Beds / Baths | Price | Details |
|---|---|---|---|---|---|

|
#31
Parc Place Dr
Milpitas, CA 95035
|
1,530 sq. feet
|
2 baths 3 beds |
show details | |

|
#32
Parc Place Dr
Milpitas, CA 95035
|
1,192 sq. feet
|
3 baths 2 beds |
show details | |

|
#33
Downsglen Way
San Jose, CA 95133
|
1,041 sq. feet
|
2 baths 3 beds |
show details | |

|
#34
Lausett Ave
San Jose, CA 95116
|
1,592 sq. feet
|
3 baths 5 beds |
show details | |

|
#35
Potts Dr
San Jose, CA 95111
|
1,890 sq. feet
|
2 baths 3 beds |
show details | |

|
#36
Landess Ave # D
San Jose, CA 95132
|
1,130 sq. feet
|
2 baths 3 beds |
show details | |

|
#37
Sierra Meadow Dr
San Jose, CA 95116
|
1,711 sq. feet
|
2 baths 4 beds |
show details | |

|
#38
Jacklin Cir
Milpitas, CA 95035
|
1,657 sq. feet
|
3 baths 3 beds |
show details | |

|
#39
Waverly Ave
San Jose, CA 95122
|
1,094 sq. feet
|
2 baths 3 beds |
show details | |

|
#40
Mauna Loa Ct
San Jose, CA 95132
|
1,530 sq. feet
|
2 baths 4 beds |
show details |
| Photo | Address | Area | Beds / Baths | Price | Details |
|---|---|---|---|---|---|

|
#41
Summerfield Dr
San Jose, CA 95121
|
1,618 sq. feet
|
2 baths 4 beds |
show details | |

|
#42
Rancho Dr Unit C
San Jose, CA 95111
|
918 sq. feet
|
2 baths 2 beds |
show details | |

|
#43
Landess Ave # A
San Jose, CA 95132
|
1,130 sq. feet
|
2 baths 3 beds |
show details | |

|
#44
Garden St
Palo Alto, CA 94303
|
1,090 sq. feet
|
1 baths 2 beds |
show details | |

|
#45
Calmor Ave Apt 3
San Jose, CA 95123
|
903 sq. feet
|
1 baths 2 beds |
show details | |

|
#46
N Capitol Ave Unit 264
San Jose, CA 95127
|
777 sq. feet
|
1 baths 1 beds |
show details | |

|
#47
Vista Roma Way
San Jose, CA 95136
|
1,674 sq. feet
|
2 baths 3 beds |
show details | |

|
#48
N Capitol Ave Unit 278
San Jose, CA 95127
|
777 sq. feet
|
1 baths 1 beds |
show details | |

|
#49
Stanford Ave
Menlo Park, CA 94025
|
1,120 sq. feet
|
1 baths 2 beds |
show details | |

|
Check over 1 million property listings on Foreclosure.com!
|
browse all offers | |||

Latest news about housing in Cupertino, CA collected exclusively by city-data.com from local newspapers, TV, and radio stations


Median year apartment built: 1976
Household type by relationship:
Households: 58,332- Male householders: 14,029 (2,051 living alone), Female householders: 6,217 (1,663 living alone)
13,430 spouses (13,360 opposite-sex spouses), 535 unmarried partners, (517 opposite-sex unmarried partners), 18,851 children (18,521 natural, 141 adopted, 188 stepchildren), 235 grandchildren, 370 brothers or sisters, 1,476 parents, 0 foster children, 665 other relatives, 2,057 non-relatives
- In group quarters: 460
Size of family households: 4,883 2-persons, 4,858 3-persons, 4,683 4-persons, 1,081 5-persons, 218 6-persons, 80 7-or-more-persons.
Size of nonfamily households: 4,090 1-person, 533 2-persons, 316 3-persons, 77 4-persons, 56 5-persons, 1 7-or-more-persons.
11,932 married couples with children.
1,121 single-parent households (242 men, 879 women).
37.7% of residents of Cupertino speak English at home.
2.1% of residents speak Spanish at home (65% speak English very well, 16% speak English well, 18% speak English not well, 1% don't speak English at all).
17.2% of residents speak other Indo-European language at home (84% speak English very well, 12% speak English well, 3% speak English not well, 1% don't speak English at all).
42.2% of residents speak Asian or Pacific Island language at home (71% speak English very well, 21% speak English well, 7% speak English not well, 2% don't speak English at all).
1.3% of residents speak other language at home (86% speak English very well, 14% speak English well).
Foreign born population: 32,282 (55.3%)
(55.5% of them are naturalized citizens)
| Here: | 6.4 |
| State: | 6.0 |
| Here: | 3.7 |
| State: | 3.9 |

- Bedrooms in owner-occupied houses and condos in Cupertino, California
- 56no bedroom
- 2531 bedroom
- 1,4122 bedrooms
- 4,1033 bedrooms
- 5,5464 bedrooms
- 1,3185+ bedrooms

- Bedrooms in renter-occupied apartments in Cupertino, California
- 761no bedroom
- 1,6181 bedroom
- 3,5882 bedrooms
- 1,3863 bedrooms
- 7614 bedrooms
- 1365+ bedrooms

- Cars and other vehicles available in Cupertino in owner-occupied houses/condos
- 166no vehicle
- 2,2291 vehicle
- 6,3102 vehicles
- 3,0893 vehicles
- 7224 vehicles
- 1745+ vehicles

- Cars and other vehicles available in Cupertino in renter-occupied apartments
- 714no vehicle
- 3,2851 vehicle
- 3,3132 vehicles
- 5423 vehicles
- 3394 vehicles
- 595+ vehicles

- Rooms in owner-occupied houses in Cupertino, California
- 561 room
- 582 rooms
- 5163 rooms
- 1,3024 rooms
- 1,9965 rooms
- 2,7846 rooms
- 2,4527 rooms
- 2,0848 rooms
- 1,4419+ rooms

- Rooms in renter-occupied apartments in Cupertino, California
- 7411 room
- 7912 rooms
- 1,8283 rooms
- 2,5854 rooms
- 1,1305 rooms
- 5726 rooms
- 2767 rooms
- 1678 rooms
- 1629+ rooms


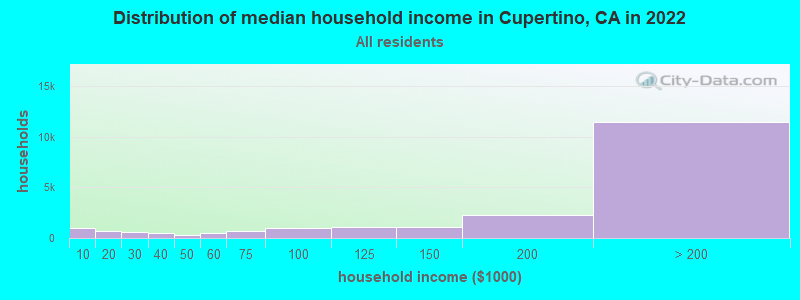
Cupertino, CA household income distribution

- 968Less than $10,000
- 693$10,000 to $19,999
- 551$20,000 to $29,999
- 490$30,000 to $39,999
- 271$40,000 to $49,999
- 522$50,000 to $59,999
- 694$60,000 to $74,999
- 969$75,000 to $99,999
- 1,089$100,000 to $124,999
- 1,083$125,000 to $149,999
- 2,245$150,000 to $199,999
- 11,466$200,000 or more
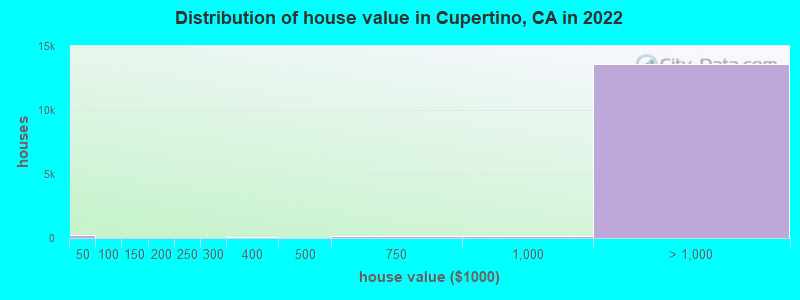
Home value of owner - occupied houses in 2022 in Cupertino, CA
-
- 180Less than $10,000
- 15$10,000 to $14,999
- 14$20,000 to $24,999
- 9$100,000 to $124,999
- 20$125,000 to $149,999
- 14$175,000 to $199,999
- 22$200,000 to $249,999
- 7$250,000 to $299,999
- 65$300,000 to $399,999
- 29$400,000 to $499,999
- 136$500,000 to $749,999
- 186$750,000 to $999,999
- 1,204$1,000,000 to $1,499,999
- 2,352$1,500,000 to $1,999,999
- 10,047$2,000,000 or more
Rent paid by renters in 2022 in Cupertino, CA
-
- 25$200 to $249
- 38$250 to $299
- 25$300 to $349
- 8$350 to $399
- 35$400 to $449
- 18$450 to $499
- 74$500 to $549
- 23$550 to $599
- 82$900 to $999
- 85$1,000 to $1,249
- 62$1,250 to $1,499
- 352$1,500 to $1,999
- 496$2,000 to $2,499
- 1,142$2,500 to $2,999
- 1,741$3,000 to $3,499
- 3,541$3,500 or more
- 180No cash rent


Percentage of workers working in this county: 91.3%
Number of people working at home: 8,694 (31.6% of all workers)
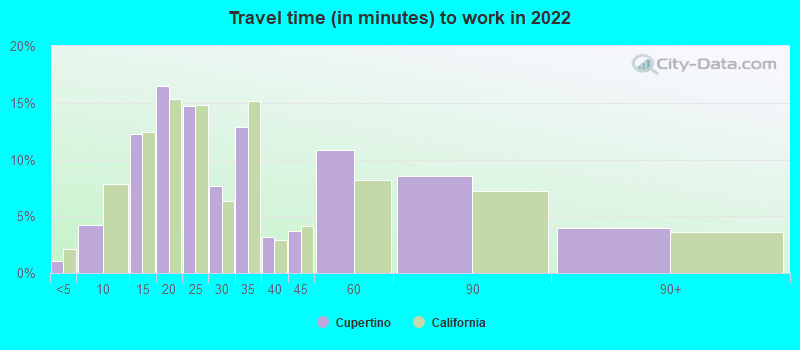
Travel time to work (commute)
- Less than 5 minutes: 271
- 5 to 9 minutes: 1,079
- 10 to 14 minutes: 2,261
- 15 to 19 minutes: 2,584
- 20 to 24 minutes: 3,814
- 25 to 29 minutes: 1,859
- 30 to 34 minutes: 4,237
- 35 to 39 minutes: 874
- 40 to 44 minutes: 811
- 45 to 59 minutes: 1,069
- 60 to 89 minutes: 405
- 90 or more minutes: 151
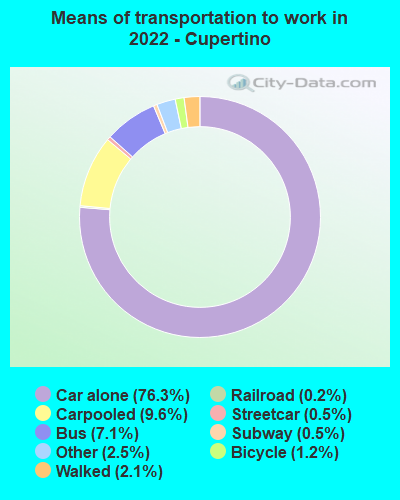
Means of transportation to work:
- Drove a car alone: 30,034 (61.9%)
- Carpooled: 3,886 (8.0%)
- Bus: 1,978 (4.1%)
- Subway or elevated rail: 122 (0.3%)
- Long-distance train or commuter rail: 165 (0.3%)
- Light rail, streetcar or trolley: 59 (0.1%)
- Ferryboat: 12 (0.0%)
- Taxi: 1,098 (2.3%)
- Bicycle: 536 (1.1%)
- Walked: 825 (1.7%)
- Worked at home: 8,694 (17.9%)

- Unemployment by race in 2022
- Unemployment rate for White non-Hispanic residents
- 4.8%Males
- 2.5%Females
- Unemployment rate for Asian residents
- 1.9%Males
- 2.3%Females
- Unemployment rate for other race residents
- 9.7%Males
- Unemployment rate for two or more race residents
- 8.0%Males
- 2.5%Females
- Unemployment rate for Hispanic or Latino residents
- 3.6%Males
- 1.4%Females

- Year of entry for the foreign-born population in Cupertino, California
- 12,0222010 or later
- 6,5522000 to 2009
- 6,9801990 to 1999
- 5,3671980 to 1989
- 3,0351970 to 1979
- 1,793Before 1970

First ancestries reported:
- American: 813 (1.9%)
- European: 765 (1.8%)
- Iranian: 590 (1.4%)
- English: 499 (1.2%)
- Irish: 468 (1.1%)
- German: 466 (1.1%)
- Russian: 349 (0.8%)
- Turkish: 288 (0.7%)
- African: 227 (0.5%)
- Polish: 216 (0.5%)
- Italian: 215 (0.5%)
- Ukrainian: 175 (0.4%)
- Haitian: 111 (0.3%)
- Egyptian: 96 (0.2%)
- British: 90 (0.2%)
- Scottish: 84 (0.2%)
- Somali: 79 (0.2%)
- Swedish: 75 (0.2%)
- Portuguese: 72 (0.2%)
- Austrian: 63 (0.1%)
- Dutch: 63 (0.1%)
- Romanian: 62 (0.1%)
- Hungarian: 57 (0.1%)
- Israeli: 57 (0.1%)
- Armenian: 55 (0.1%)
- French: 55 (0.1%)
- Scandinavian: 52 (0.1%)
- Northern European: 49 (0.1%)
- French Canadian: 40 (0.09%)
- Norwegian: 37 (0.09%)
- Scotch-Irish: 34 (0.08%)
- Finnish: 34 (0.08%)
- Lithuanian: 26 (0.06%)
- Yugoslavian: 24 (0.06%)
- Palestinian: 18 (0.04%)
- Slavic: 17 (0.04%)
- Moroccan: 16 (0.04%)
- Slovak: 16 (0.04%)
- Czech: 15 (0.04%)
- Slovene: 14 (0.03%)
- Pennsylvania German: 14 (0.03%)
- Swiss: 14 (0.03%)
- Welsh: 13 (0.03%)
- Eastern European: 12 (0.03%)
- Lebanese: 11 (0.03%)
- Danish: 11 (0.03%)
- Bulgarian: 9 (0.02%)
- Greek: 8 (0.02%)
- Arab: 8 (0.02%)
- Nigerian: 6 (0.01%)
- Serbian: 5 (0.01%)
- Syrian: 5 (0.01%)
Most common places of birth for foreign-born residents (%):
| Cupertino: | 39.9% (12,876) |
| California: | 5.2% (539,184) |
| Cupertino: | 18.1% (5,834) |
| California: | 6.6% (684,672) |
| Cupertino: | 13.1% (4,222) |
| California: | 1.7% (176,274) |
| Cupertino: | 4.5% (1,440) |
| California: | 3.0% (315,248) |
| Cupertino: | 3.6% (1,150) |
| California: | 1.0% (105,215) |
| Cupertino: | 2.6% (824) |
| California: | 1.0% (103,575) |
| Cupertino: | 1.8% (579) |
| California: | 4.9% (512,335) |
| Cupertino: | 1.5% (487) |
| California: | 0.7% (71,932) |
Place of birth for U.S.-born residents:
- This state: 18,656
- Other state: 7,168
- Northeast: 2,400
- Midwest: 1,934
- South: 1,248
- West: 1,617
82.5% of Cupertino residents lived in the same house 1 years ago.
Out of people who lived in different houses, 39.3% lived in this county.
Out of people who lived in different counties, 69.8% lived in California.
| Cupertino: | 82.5% |
| State average: | 88.9% |
Education attainment for males 25 years and older:
- No schooling: 109
- Nursery to 4th grade: 7
- 5th and 6th grade: 21
- 7th and 8th grade: 41
- 9th grade: 22
- 10th grade: 5
- 11th grade: 24
- 12th grade, no diploma: 70
- High school graduate (or equivalency): 657
- Less than 1 year of college: 270
- Some college more than 1 year, no degree: 737
- Associate degree: 692
- Bachelor's degree: 6,509
- Master's degree: 8,033
- Professional school degree: 894
- Doctorate degree: 2,824

Education attainment for females 25 years and older:
- No schooling: 362
- Nursery to 4th grade: 27
- 5th and 6th grade: 71
- 7th and 8th grade: 117
- 9th grade: 30
- 10th grade: 81
- 11th grade: 6
- 12th grade, no diploma: 128
- High school graduate (or equivalency): 934
- Less than 1 year of college: 326
- Some college more than 1 year, no degree: 854
- Associate degree: 999
- Bachelor's degree: 7,139
- Master's degree: 6,691
- Professional school degree: 940
- Doctorate degree: 996


Housing units in structures:
- One, detached: 12,454
- One, attached: 3,152
- Two: 438
- 3 or 4: 1,410
- 5 to 9: 1,027
- 10 to 19: 527
- 20 to 49: 652
- 50 or more: 2,504
- Mobile homes: 27
Housing units lacking complete kitchen facilities in 2022: 1.0%
House/condo owner moved in on average 16 years ago
Renter moved in on average 1 years ago

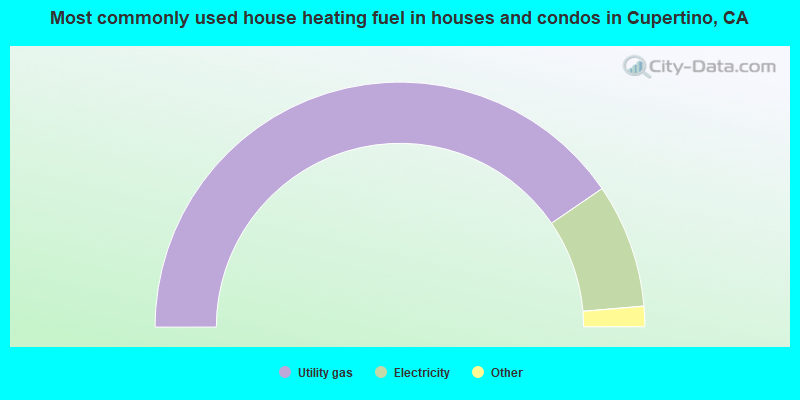
- 80.9%Utility gas
- 16.4%Electricity
- 1.4%Bottled, tank, or LP gas
- 0.5%Solar energy
- 0.5%No fuel used
- 0.2%Wood
- 0.1%Fuel oil, kerosene, etc.
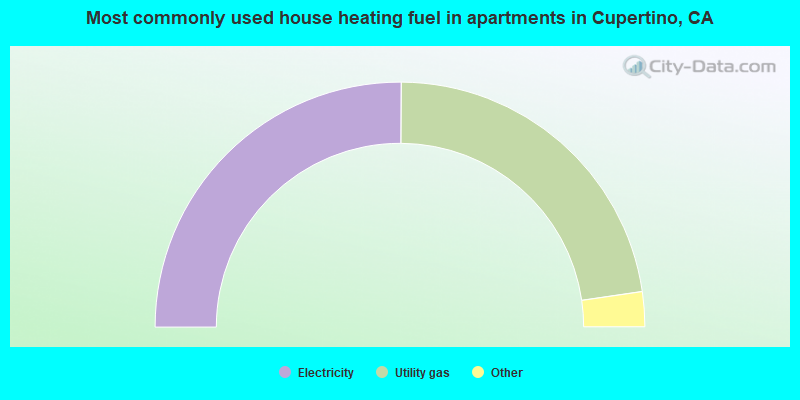
- 50.2%Electricity
- 45.2%Utility gas
- 1.6%Bottled, tank, or LP gas
- 1.3%No fuel used
- 0.7%Other fuel
- 0.4%Fuel oil, kerosene, etc.
- 0.4%Coal or coke
- 0.1%Solar energy
Private vs. public school enrollment:
| Here: | 10.8% |
| California: | 10.5% |
| Here: | 16.0% |
| California: | 8.5% |
| Here: | 9.6% |
| California: | 15.9% |


