Coachella Valley, CA (California) Houses and Residents
| Coachella Valley: | $430,744 |
| California: | $715,900 |
Total population: 156,830 (Urban population: 104,037 (91,344 inside urbanized areas, 12,693 inside urban clusters), Rural population: 14,895 (561 farm, 14,334 nonfarm))
Houses: 38,953 (32,877 occupied: 20,205 owner occupied, 12,672 renter occupied)
| % of renters here: | 39% |
| State: | 44% |
Housing density: 129 houses/condos per square mile
Median price asked for vacant for-sale houses and condos in 2022 in this county: $550,307.
Median contract rent in 2022: $1,192 (lower quartile is $737, upper quartile is $1,648)
Median rent asked for vacant for-rent units in 2022: $1,265
Median gross rent in Coachella Valley, CA in 2022: $1,415
Housing units in Coachella Valley with a mortgage: 11,971 (1,073 second mortgage, 619 home equity loan, 45 both second mortgage and home equity loan)
Houses without a mortgage: 4,149


Household type by relationship:
Households: 2,153,812- In family households: 1,916,707 (357,691 male householders, 152,550 female householders)
376,381 spouses, 728,028 children (675,451 natural, 15,499 adopted, 37,078 stepchildren), 69,455 grandchildren, 34,232 brothers or sisters, 33,896 parents, foster children, 57,727 other relatives, 76,462 non-relatives
- In nonfamily households: 237,105 (84,686 male householders (58,397 living alone)), 91,333 female householders (74,097 living alone)), 61,086 nonrelatives
- In group quarters: 35,829 (20,862 institutionalized population)
308,692 married couples with children.
98,911 single-parent households (26,262 men, 72,649 women).
33.8% of residents of Coachella Valley speak English at home.
64.1% of residents speak Spanish at home (39% speak English very well, 22% speak English well, 19% speak English not well, 20% don't speak English at all).
1.1% of residents speak other Indo-European language at home (68% speak English very well, 25% speak English well, 4% speak English not well, 3% don't speak English at all).
0.8% of residents speak Asian or Pacific Island language at home (60% speak English very well, 24% speak English well, 11% speak English not well, 4% don't speak English at all).
0.2% of residents speak other language at home (64% speak English very well, 14% speak English well, 3% speak English not well, 18% don't speak English at all).
Foreign born population: 81,691 (42.9%)
(35.5% of them are naturalized citizens)
| Here: | 6.1 |
| State: | 6.0 |
| Here: | 4.3 |
| State: | 3.9 |

- Bedrooms in owner-occupied houses and condos in Coachella Valley, California
- 967no bedroom
- 1,9631 bedroom
- 5,4242 bedrooms
- 7,7453 bedrooms
- 3,7404 bedrooms
- 3665+ bedrooms

- Bedrooms in renter-occupied apartments in Coachella Valley, California
- 1,507no bedroom
- 4,0981 bedroom
- 4,4512 bedrooms
- 1,9243 bedrooms
- 5924 bedrooms
- 1005+ bedrooms

- Cars and other vehicles available in Coachella Valley in owner-occupied houses/condos
- 682no vehicle
- 5,8671 vehicle
- 9,1792 vehicles
- 3,1413 vehicles
- 1,0014 vehicles
- 3355+ vehicles

- Cars and other vehicles available in Coachella Valley in renter-occupied apartments
- 2,025no vehicle
- 5,9961 vehicle
- 3,9062 vehicles
- 5693 vehicles
- 764 vehicles
- 1005+ vehicles

- Rooms in owner-occupied houses in Coachella Valley, California
- 1891 room
- 1,0022 rooms
- 2,8843 rooms
- 2,3294 rooms
- 4,6915 rooms
- 4,8846 rooms
- 2,7077 rooms
- 9728 rooms
- 5479+ rooms

- Rooms in renter-occupied apartments in Coachella Valley, California
- 9211 room
- 2,6182 rooms
- 3,1463 rooms
- 2,7774 rooms
- 1,6225 rooms
- 1,0606 rooms
- 4107 rooms
- 788 rooms
- 409+ rooms


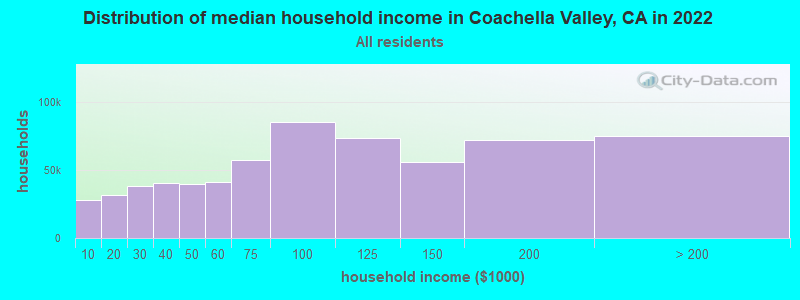
Coachella Valley, CA household income distribution

- 27,994Less than $10,000
- 31,658$10,000 to $19,999
- 38,209$20,000 to $29,999
- 40,601$30,000 to $39,999
- 40,098$40,000 to $49,999
- 41,236$50,000 to $59,999
- 57,739$60,000 to $74,999
- 85,442$75,000 to $99,999
- 73,531$100,000 to $124,999
- 56,239$125,000 to $149,999
- 71,854$150,000 to $199,999
- 75,189$200,000 or more
Percentage of workers working in this county: 101.1%
Number of people working at home: 9,223 (11.7% of all workers)
Travel time to work (commute)
- Less than 5 minutes: 886
- 5 to 9 minutes: 3,931
- 10 to 14 minutes: 6,354
- 15 to 19 minutes: 8,454
- 20 to 24 minutes: 7,157
- 25 to 29 minutes: 2,487
- 30 to 34 minutes: 6,838
- 35 to 39 minutes: 619
- 40 to 44 minutes: 734
- 45 to 59 minutes: 1,208
- 60 to 89 minutes: 826
- 90 or more minutes: 956
Means of transportation to work:
- Drove a car alone: 26,841 (64.5%)
- Carpooled: 11,267 (27.1%)
- Bus or trolley bus: 446 (1.1%)
- Streetcar or trolley car: 19 (0.0%)
- Taxi: 13 (0.0%)
- Motorcycle: 67 (0.2%)
- Bicycle: 107 (0.3%)
- Walked: 892 (2.1%)
- Other means: 798 (1.9%)
- Worked at home: 1,185 (2.8%)


- Year of entry for the foreign-born population in Coachella Valley, California
- 9,5451995 to March 2000
- 7,0141990 to 1994
- 8,9731985 to 1989
- 5,1981980 to 1984
- 4,2181975 to 1979
- 3,3791970 to 1974
- 2,0081965 to 1969
- 3,788Before 1965
Most common places of birth for foreign-born residents (%):
| Coachella Valley: | 91.0% (40,155) |
| California: | 44.3% (3,928,701) |
| Coachella Valley: | 1.9% (829) |
| California: | 4.1% (359,673) |
Place of birth for U.S.-born residents:
- This state: 55,873
- Other state: 18,114
- Northeast: 3,144
- Midwest: 5,881
- South: 5,282
- West: 3,807
54% of Coachella Valley residents lived in the same house 5 years ago.
Out of people who lived in different houses, 75% lived in this county.
Out of people who lived in different counties, 68% lived in California.
Education attainment for males 25 years and older:
- No schooling: 2,575
- Nursery to 4th grade: 1,448
- 5th and 6th grade: 3,572
- 7th and 8th grade: 1,817
- 9th grade: 1,535
- 10th grade: 1,085
- 11th grade: 1,204
- 12th grade, no diploma: 2,015
- High school graduate (or equivalency): 5,947
- Less than 1 year of college: 1,933
- Some college more than 1 year, no degree: 3,892
- Associate degree: 990
- Bachelor's degree: 2,694
- Master's degree: 839
- Professional school degree: 587
- Doctorate degree: 153

Education attainment for females 25 years and older:
- No schooling: 2,300
- Nursery to 4th grade: 1,412
- 5th and 6th grade: 3,056
- 7th and 8th grade: 1,722
- 9th grade: 1,619
- 10th grade: 1,226
- 11th grade: 997
- 12th grade, no diploma: 1,929
- High school graduate (or equivalency): 7,202
- Less than 1 year of college: 2,459
- Some college more than 1 year, no degree: 3,576
- Associate degree: 1,530
- Bachelor's degree: 2,081
- Master's degree: 822
- Professional school degree: 284
- Doctorate degree: 50


Housing units in structures:
- One, detached: 21,109
- One, attached: 2,438
- Two: 553
- 3 or 4: 2,305
- 5 to 9: 1,602
- 10 to 19: 1,112
- 20 to 49: 510
- 50 or more: 2,428
- Mobile homes: 6,410
- Boats, RVs, vans, etc.: 486
Median worth of mobile homes: $52,291
Housing units lacking complete kitchen facilities: 1.1%

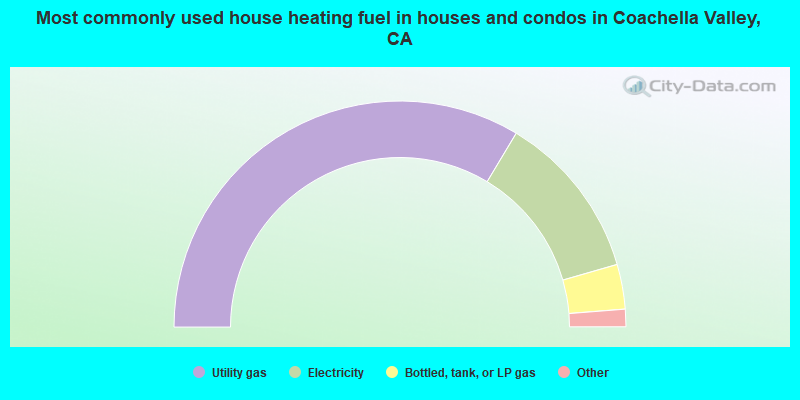
- 67.2%Utility gas
- 23.9%Electricity
- 6.4%Bottled, tank, or LP gas
- 1.8%No fuel used
- 0.3%Wood
- 0.2%Solar energy
- 0.1%Other fuel
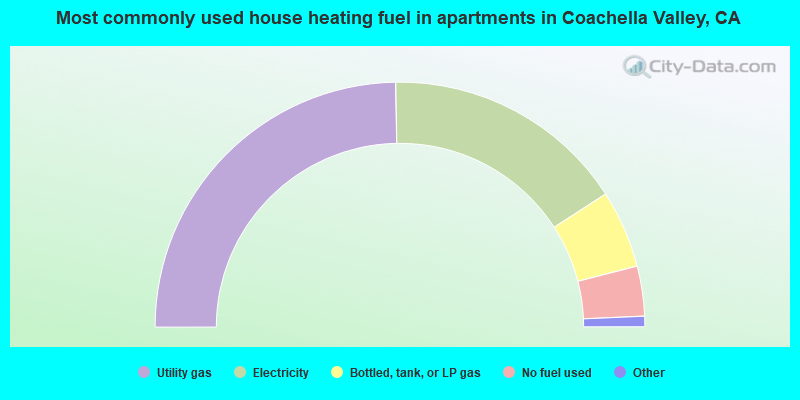
- 49.5%Utility gas
- 32.3%Electricity
- 10.3%Bottled, tank, or LP gas
- 6.6%No fuel used
- 0.8%Solar energy
- 0.4%Other fuel
- 0.2%Fuel oil, kerosene, etc.
Private vs. public school enrollment:
| Here: | 3.4% |
| California: | 9.9% |
| Here: | 3.3% |
| California: | 7.8% |
| Here: | 5.5% |
| California: | 15.4% |


