Jump to a detailed profile or search site with Google Custom Search

Berkeley, CA (California) Houses and Residents

Estimated median house or condo value in 2022: $1,445,100 (it was $374,300 in 2000)
Berkeley:

$1,445,100
California:

$715,900
Lower value quartile - upper value quartile: $1,027,600 - $1,970,700

Mean price in 2022:

Detached houses: $1,623,054
Here:

$1,623,054
State:

$988,808

Townhouses or other attached units: $1,249,031
Here:

$1,249,031
State:

$838,546

In 2-unit structures: $1,976,622
Here:

$1,976,622
State:

$1,138,100

In 3-to-4-unit structures: $2,259,719
Here:

$2,259,719
State:

$824,253

In 5-or-more-unit structures: $2,168,147
Here:

$2,168,147
State:

$730,996

Total population: 118,853 (Urban population: 102,743, Rural population: 0)

Houses: 51,183 (47,052 occupied: 20,133 owner occupied, 26,919 renter occupied)

% of renters here:

57%
State:

44%

Housing density: 4,894 houses/condos per square mile

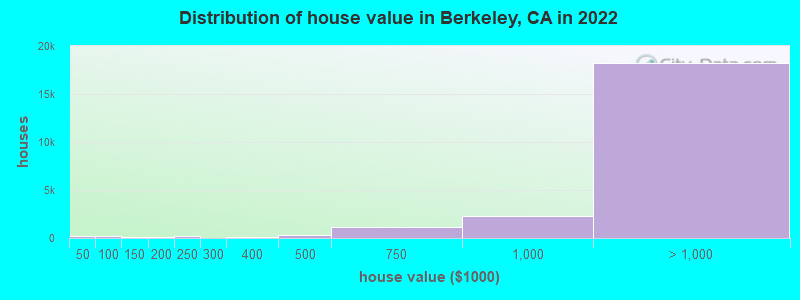
Median price asked for vacant for-sale houses and condos in 2022: $1,328,867.

Median contract rent in 2022: $1,876 (lower quartile is $1,306, upper quartile is over $2,000)


Median rent asked for vacant for-rent units in 2022: $1,578


Median gross rent in Berkeley, CA in 2022: over $2,000

Housing units in Berkeley with a mortgage: 13,603 (2,148 second mortgage, 30 home equity loan, 2,033 both second mortgage and home equity loan)
Houses without a mortgage: 451

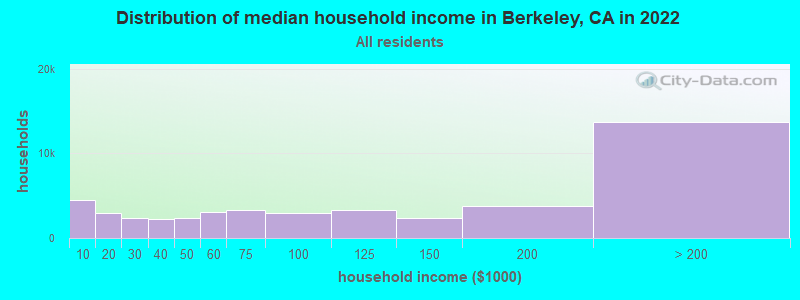
Median household income for houses/condos with a mortgage: $236,239

Median household income for apartments without a mortgage: $147,135

Median monthly housing costs: $2,213

Compare current foreclosures in Berkeley, CA:

Check out more offers in Berkeley, CA.
Powered by Foreclosure.com

Settings
X
Data:
Loading data...
Based on 2000-2022 data
Loading data...

123
Hide US histogram

Latest news about housing in Berkeley, CA collected exclusively by city-data.com from local newspapers, TV, and radio stations

Berkeley, California Age and Sex of Residents
Median year house/condo built: 1938

Median year apartment built: 1965

Household type by relationship:

Households: 118,942
  • Male householders: 23,027 (6,930 living alone), Female householders: 24,025 (8,931 living alone)
  • 16,293 spouses (15,658 opposite-sex spouses), 4,396 unmarried partners, (3,916 opposite-sex unmarried partners), 18,567 children (17,443 natural, 457 adopted, 667 stepchildren), 1,698 grandchildren, 1,046 brothers or sisters, 723 parents, 0 foster children, 1,615 other relatives, 16,173 non-relatives
  • In group quarters: 11,379

Size of family households: 10,278 2-persons, 5,163 3-persons, 4,038 4-persons, 828 5-persons, 286 6-persons, 289 7-or-more-persons.

Size of nonfamily households: 15,861 1-person, 7,030 2-persons, 1,861 3-persons, 1,122 4-persons, 86 5-persons, 41 6-persons, 169 7-or-more-persons.

10,657 married couples with children.
3,144 single-parent households (456 men, 2,688 women).

70.5% of residents of Berkeley speak English at home.
8.3% of residents speak Spanish at home (75% speak English very well, 16% speak English well, 7% speak English not well, 2% don't speak English at all).
8.5% of residents speak other Indo-European language at home (86% speak English very well, 11% speak English well, 3% speak English not well).
11.3% of residents speak Asian or Pacific Island language at home (73% speak English very well, 20% speak English well, 6% speak English not well, 1% don't speak English at all).
1.2% of residents speak other language at home (77% speak English very well, 12% speak English well, 10% speak English not well, 1% don't speak English at all).

Foreign born population: 24,794 (20.8%)
(44.8% of them are naturalized citizens)

Median number of rooms in houses and condos:
Here:

6.4
State:

6.0

Median number of rooms in apartments
Here:

3.3
State:

3.9

Owner-occupied Renter-occupied
Bedrooms in owner-occupied houses and condos in Berkeley, California
  • Bedrooms in owner-occupied houses and condos in Berkeley, California
  • 90no bedroom
  • 1,1831 bedroom
  • 5,8372 bedrooms
  • 6,9003 bedrooms
  • 3,9994 bedrooms
  • 2,1245+ bedrooms
Bedrooms in renter-occupied apartments in Berkeley, California
  • Bedrooms in renter-occupied apartments in Berkeley, California
  • 6,468no bedroom
  • 7,8191 bedroom
  • 9,5312 bedrooms
  • 1,7173 bedrooms
  • 1,0674 bedrooms
  • 3175+ bedrooms
Owner-occupied Renter-occupied
Cars and other vehicles available in Berkeley in owner-occupied houses/condos
  • Cars and other vehicles available in Berkeley in owner-occupied houses/condos
  • 1,123no vehicle
  • 8,5811 vehicle
  • 7,5292 vehicles
  • 2,2743 vehicles
  • 4154 vehicles
  • 2115+ vehicles
Cars and other vehicles available in Berkeley in renter-occupied apartments
  • Cars and other vehicles available in Berkeley in renter-occupied apartments
  • 8,805no vehicle
  • 12,9991 vehicle
  • 4,3862 vehicles
  • 5223 vehicles
  • 1284 vehicles
  • 795+ vehicles
Owner-occupied Renter-occupied
Rooms in owner-occupied houses in Berkeley, California
  • Rooms in owner-occupied houses in Berkeley, California
  • 481 room
  • 2192 rooms
  • 1,0853 rooms
  • 1,5894 rooms
  • 2,8245 rooms
  • 4,6076 rooms
  • 2,7487 rooms
  • 2,7778 rooms
  • 4,2369+ rooms
Rooms in renter-occupied apartments in Berkeley, California
  • Rooms in renter-occupied apartments in Berkeley, California
  • 5,6381 room
  • 2,5112 rooms
  • 6,3253 rooms
  • 6,9464 rooms
  • 3,3925 rooms
  • 7966 rooms
  • 5487 rooms
  • 3798 rooms
  • 3849+ rooms
Year house built
Median 2022 house/condo value by year built
Median house/condo value by year householder moved into unit
Breakdown of mean house values by ages of householders
Owners and renters by unit type in Berkeley, CA
  • Berkeley, CA household income distribution

  • Distribution of median household income in Berkeley, CA in 2022
  • 4,509Less than $10,000
  • 2,958$10,000 to $19,999
  • 2,374$20,000 to $29,999
  • 2,247$30,000 to $39,999
  • 2,390$40,000 to $49,999
  • 3,051$50,000 to $59,999
  • 3,337$60,000 to $74,999
  • 2,941$75,000 to $99,999
  • 3,339$100,000 to $124,999
  • 2,408$125,000 to $149,999
  • 3,778$150,000 to $199,999
  • 13,720$200,000 or more
  • Home value of owner - occupied houses in 2022 in Berkeley, CA

  • Distribution of house value in Berkeley, CA in 2022
  • 210Less than $10,000
  • 42$10,000 to $14,999
  • 7$20,000 to $24,999
  • 14$50,000 to $59,999
  • 53$60,000 to $69,999
  • 57$70,000 to $79,999
  • 29$80,000 to $89,999
  • 18$90,000 to $99,999
  • 117$100,000 to $124,999
  • 25$125,000 to $149,999
  • 43$150,000 to $174,999
  • 11$175,000 to $199,999
  • 165$200,000 to $249,999
  • 41$250,000 to $299,999
  • 139$300,000 to $399,999
  • 285$400,000 to $499,999
  • 1,098$500,000 to $749,999
  • 2,325$750,000 to $999,999
  • 6,750$1,000,000 to $1,499,999
  • 5,850$1,500,000 to $1,999,999
  • 5,672$2,000,000 or more
  • Rent paid by renters in 2022 in Berkeley, CA

  • Distribution of rent paid by renters in Berkeley, CA in 2022
  • 81$150 to $199
  • 150$200 to $249
  • 272$250 to $299
  • 356$400 to $449
  • 42$500 to $549
  • 40$550 to $599
  • 100$600 to $649
  • 240$650 to $699
  • 231$700 to $749
  • 469$750 to $799
  • 426$800 to $899
  • 1,537$900 to $999
  • 2,169$1,000 to $1,249
  • 2,279$1,250 to $1,499
  • 6,463$1,500 to $1,999
  • 4,791$2,000 to $2,499
  • 3,442$2,500 to $2,999
  • 826$3,000 to $3,499
  • 2,579$3,500 or more
  • 426No cash rent
Time Leaving Home To Go To Work in 2022

Percentage of workers working in this county: 80.5%
Number of people working at home: 21,643 (36.4% of all workers)

Travel time (in minutes) to work in 2022

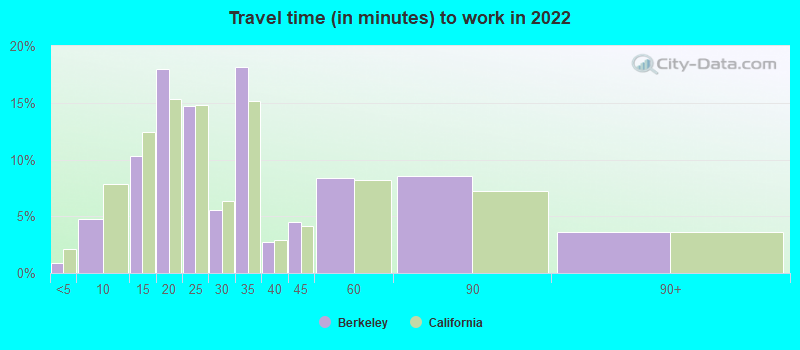
Travel time to work (commute)

  • Less than 5 minutes: 745
  • 5 to 9 minutes: 2,583
  • 10 to 14 minutes: 5,179
  • 15 to 19 minutes: 7,580
  • 20 to 24 minutes: 4,511
  • 25 to 29 minutes: 2,086
  • 30 to 34 minutes: 4,444
  • 35 to 39 minutes: 1,210
  • 40 to 44 minutes: 1,612
  • 45 to 59 minutes: 3,485
  • 60 to 89 minutes: 3,125
  • 90 or more minutes: 1,310
Means of transportation to work in 2022 - Berkeley

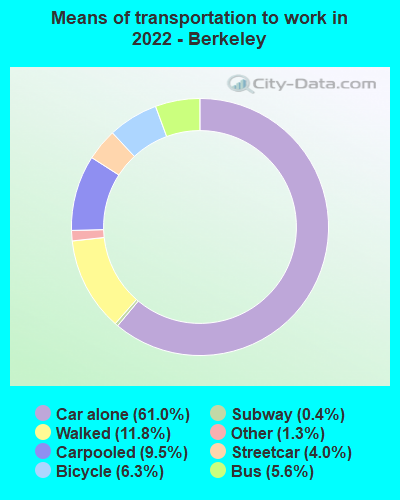
Means of transportation to work:

  • Drove a car alone: 33,775 (43.9%)
  • Carpooled: 5,240 (6.8%)
  • Bus: 3,122 (4.1%)
  • Subway or elevated rail: 2,219 (2.9%)
  • Long-distance train or commuter rail: 248 (0.3%)
  • Taxi: 727 (0.9%)
  • Bicycle: 3,467 (4.5%)
  • Walked: 6,537 (8.5%)
  • Worked at home: 21,643 (28.1%)
Class of Workers in 2022
  • Unemployment by race in 2022
  • Unemployment rate for White non-Hispanic residents
  • 2.5%Males
  • 1.3%Females
  • Unemployment rate for Black residents
  • 6.5%Males
  • 2.1%Females
  • Unemployment rate for American Indian and Alaska Native residents
  • 5.5%Males
  • 1.5%Females
  • Unemployment rate for Asian residents
  • 4.8%Males
  • 7.5%Females
  • Unemployment rate for other race residents
  • 2.7%Males
  • 13.0%Females
  • Unemployment rate for two or more race residents
  • 6.9%Males
  • Unemployment rate for Hispanic or Latino residents
  • 8.5%Males
  • 12.7%Females
Year of entry for the foreign-born population in Berkeley, California
  • Year of entry for the foreign-born population in Berkeley, California
  • 12,6152010 or later
  • 5,2912000 to 2009
  • 3,2441990 to 1999
  • 6,4371980 to 1989
  • 2,5171970 to 1979
  • 2,866Before 1970
Ancestries in Berkeley, CA

First ancestries reported:

  • English: 3,054 (5.3%)
  • Irish: 2,075 (3.6%)
  • European: 2,055 (3.5%)
  • German: 1,871 (3.2%)
  • American: 1,196 (2.1%)
  • Italian: 1,128 (1.9%)
  • Iranian: 1,099 (1.9%)
  • Eastern European: 905 (1.6%)
  • French: 890 (1.5%)
  • Polish: 769 (1.3%)
  • Russian: 634 (1.1%)
  • British: 506 (0.9%)
  • Northern European: 482 (0.8%)
  • Norwegian: 356 (0.6%)
  • African: 338 (0.6%)
  • Ukrainian: 320 (0.6%)
  • Lithuanian: 274 (0.5%)
  • Armenian: 251 (0.4%)
  • Swedish: 248 (0.4%)
  • Scottish: 248 (0.4%)
  • French Canadian: 243 (0.4%)
  • Scotch-Irish: 238 (0.4%)
  • Swiss: 234 (0.4%)
  • Dutch: 232 (0.4%)
  • Hungarian: 200 (0.3%)
  • Lebanese: 196 (0.3%)
  • Turkish: 194 (0.3%)
  • Greek: 173 (0.3%)
  • Belgian: 134 (0.2%)
  • Brazilian: 117 (0.2%)
  • Israeli: 95 (0.2%)
  • Danish: 91 (0.2%)
  • Scandinavian: 88 (0.2%)
  • Welsh: 85 (0.1%)
  • Ethiopian: 84 (0.1%)
  • Belizean: 84 (0.1%)
  • Canadian: 81 (0.1%)
  • Romanian: 71 (0.1%)
  • Haitian: 71 (0.1%)
  • Arab: 65 (0.1%)
  • Croatian: 64 (0.1%)
  • Finnish: 63 (0.1%)
  • Australian: 60 (0.1%)
  • Austrian: 57 (0.10%)
  • Nigerian: 53 (0.09%)
  • South African: 53 (0.09%)
  • Afghan: 45 (0.08%)
  • Moroccan: 43 (0.07%)
  • British West Indian: 41 (0.07%)
  • Egyptian: 40 (0.07%)
  • Portuguese: 40 (0.07%)
  • Palestinian: 34 (0.06%)
  • Ghanaian: 33 (0.06%)
  • New Zealander: 32 (0.06%)
  • Kenyan: 31 (0.05%)
  • Latvian: 30 (0.05%)
  • Ugandan: 30 (0.05%)
  • Jamaican: 26 (0.04%)
  • Basque: 23 (0.04%)
  • Liberian: 21 (0.04%)
  • Slovak: 17 (0.03%)
  • Senegalese: 17 (0.03%)
  • Iraqi: 15 (0.03%)
  • Sierra Leonean: 14 (0.02%)
  • Assyrian: 14 (0.02%)
  • Icelander: 13 (0.02%)
  • Czech: 13 (0.02%)
  • Yugoslavian: 13 (0.02%)
  • Bulgarian: 11 (0.02%)
  • Slavic: 8 (0.01%)
  • Luxembourger: 8 (0.01%)
  • Guyanese: 6 (0.01%)
  • Czechoslovakian: 6 (0.01%)
  • Serbian: 5 (0.01%)
  • Slovene: 5 (0.01%)

Most common places of birth for foreign-born residents (%):

China, excluding Hong Kong and Taiwan
Berkeley:

16.6% (4,368)
California:

6.6% (684,672)

India
Berkeley:

9.5% (2,507)
California:

5.2% (539,184)

Mexico
Berkeley:

7.9% (2,093)
California:

37.2% (3,881,193)

Korea
Berkeley:

6.2% (1,638)
California:

3.0% (315,248)

France
Berkeley:

4.0% (1,066)
California:

0.4% (40,224)

Canada
Berkeley:

3.4% (906)
California:

1.2% (127,477)

Iran
Berkeley:

3.1% (826)
California:

2.0% (206,004)

Japan
Berkeley:

2.4% (639)
California:

1.0% (103,575)

Taiwan
Berkeley:

2.3% (616)
California:

1.7% (176,274)

Russia
Berkeley:

2.3% (612)
California:

0.7% (71,932)

Germany
Berkeley:

2.2% (579)
California:

0.7% (73,304)

Nepal
Berkeley:

1.9% (501)
California:

0.2% (16,541)

Philippines
Berkeley:

1.9% (492)
California:

7.8% (818,297)

Israel
Berkeley:

1.9% (491)
California:

0.3% (33,029)

Hong Kong
Berkeley:

1.8% (482)
California:

1.0% (105,215)

England
Berkeley:

1.6% (422)
California:

0.6% (57,953)

United Kingdom, excluding England and Scotland
Berkeley:

1.6% (420)
California:

0.6% (60,582)

El Salvador
Berkeley:

1.6% (419)
California:

4.2% (440,287)

Brazil
Berkeley:

1.5% (408)
California:

0.5% (53,222)

Spain
Berkeley:

1.5% (402)
California:

0.2% (16,586)

Place of birth for U.S.-born residents:

  • This state: 55,663
  • Other state: 35,559
  • Northeast: 12,383
  • Midwest: 9,802
  • South: 8,096
  • West: 5,278

72.3% of Berkeley residents lived in the same house 1 years ago.
   Out of people who lived in different houses, 28.9% lived in this county.
   Out of people who lived in different counties, 71.6% lived in California.


Berkeley:

72.3%
State average:

88.9%

Education attainment for males 25 years and older:

  • No schooling: 429
  • Nursery to 4th grade: 0
  • 5th and 6th grade: 0
  • 7th and 8th grade: 75
  • 9th grade: 171
  • 10th grade: 32
  • 11th grade: 12
  • 12th grade, no diploma: 109
  • High school graduate (or equivalency): 1,305
  • Less than 1 year of college: 790
  • Some college more than 1 year, no degree: 3,089
  • Associate degree: 1,460
  • Bachelor's degree: 11,141
  • Master's degree: 7,598
  • Professional school degree: 2,871
  • Doctorate degree: 4,976
Educational Attainment for Males

Education attainment for females 25 years and older:

  • No schooling: 579
  • Nursery to 4th grade: 0
  • 5th and 6th grade: 4
  • 7th and 8th grade: 42
  • 9th grade: 47
  • 10th grade: 244
  • 11th grade: 39
  • 12th grade, no diploma: 246
  • High school graduate (or equivalency): 1,557
  • Less than 1 year of college: 660
  • Some college more than 1 year, no degree: 1,673
  • Associate degree: 2,158
  • Bachelor's degree: 14,894
  • Master's degree: 9,305
  • Professional school degree: 3,209
  • Doctorate degree: 3,274
Educational Attainment for Females
Berkeley marital status for males
Berkeley marital status for females

Housing units in structures:

  • One, detached: 20,866
  • One, attached: 1,684
  • Two: 4,305
  • 3 or 4: 5,302
  • 5 to 9: 5,990
  • 10 to 19: 3,440
  • 20 to 49: 4,900
  • 50 or more: 4,646
  • Mobile homes: 50
Housing units lacking complete plumbing facilities in 2022: 1.2%

Housing units lacking complete kitchen facilities in 2022: 3.5%

House/condo owner moved in on average 18 years ago

Renter moved in on average 1 years ago

Year householders moved into residence in Berkeley
Houses and condos Apartments
Most commonly used house heating fuel in houses and condos in Berkeley, CA
  • 84.2%Utility gas
  • 12.6%Electricity
  • 1.1%Solar energy
  • 0.8%No fuel used
  • 0.7%Bottled, tank, or LP gas
  • 0.5%Wood
Most commonly used house heating fuel in apartments in Berkeley, CA
  • 57.1%Utility gas
  • 35.8%Electricity
  • 4.9%No fuel used
  • 1.1%Bottled, tank, or LP gas
  • 0.5%Solar energy
  • 0.4%Other fuel
  • 0.1%Wood
  • 0.1%Coal or coke

Private vs. public school enrollment:

Students in private schools in grades 1 to 8 (elementary and middle school): 2,027
Here:

29.0%
California:

10.5%

Students in private schools in grades 9 to 12 (high school): 234
Here:

8.4%
California:

8.5%

Students in private undergraduate colleges: 406
Here:

1.6%
California:

15.9%
School Enrollment by Level of School for Male Students
School Enrollment by Level of School for Female Students
Age and Sex of Sensory-Disabled Noninstitutionalized Residents
Age and Sex of Physically-Disabled Noninstitutionalized Residents
Age and Sex of Mentally-Disabled Noninstitutionalized Residents
Age and Sex of Self-Care Disabled Noninstitutionalized Residents
Age and Sex of Go-Outside-Home Disabled Noninstitutionalized Residents
Age and Sex of Noninstitutionalized Residents with Employment Disability