| Fire incidents reported |
|---|
| Sreet name | Count |
|---|
| LAKE SHORE DR | 12 | | SULLIVAN ST | 12 | | KINGSTON AVE | 10 | | LITTLE RD | 10 | | NYS ROUTE 17 | 8 | | WURTSBORO MT RD | 8 | | NYS RT 17 | 6 | | OLD WESTBROOKVILLE RD | 6 | | PINE ST | 6 | | SARINE RD | 6 | | WURTSBORO FIRE HOUSE | 6 | | WURTSBORO MTN RD | 6 | | ARBUTUS TRAIL | 4 | | BARONE RD | 4 | | CTY RT 56 | 4 | | FERGUSON LANE | 4 | | NORTH SHORE DR | 4 | | PARK RD | 4 | | POPLAR TR | 4 | | STATE ROUTE 17 | 4 | | 14 GREGORY STREET | 2 | | 20 LAKE SHORE DRIVE | 2 | | 31 SUNSET DRIVE | 2 | | 329 WILSEY VALLEY ROAD | 2 | | 383 COUNTY ROAD 56 | 2 |
| | | Fire incidents reported |
|---|
| Sreet name | Count |
|---|
| 497 YANKEE LAKE ROAD | 2 | | 6 HIGHVIEW AVENUE | 2 | | 69 EAST ROAD | 2 | | 7 LOCUST TRAIL | 2 | | 8 WILSEY VALLEY ROAD | 2 | | 89 KINGFISHER TRAIL | 2 | | 986 WURTSBORO MOUNTAIN RD | 2 | | ARBUTUS TRL | 2 | | BALLER ST | 2 | | BEACH RD | 2 | | BUCK HILLHUNTING CAMP RD | 2 | | BURGER LANE | 2 | | BURGER LN | 2 | | CANAL RD | 2 | | CASEY LN | 2 | | CEDAR RD | 2 | | CEDAR TR | 2 | | CHASE SCHOOL | 2 | | COTTAGE ST | 2 | | COUNTY RT 56 | 2 | | CYDER PRESS RD | 2 | | DOGWOOD LN | 2 | | DOGWOOD RD | 2 | | DOGWOOD TR | 2 | | |
|
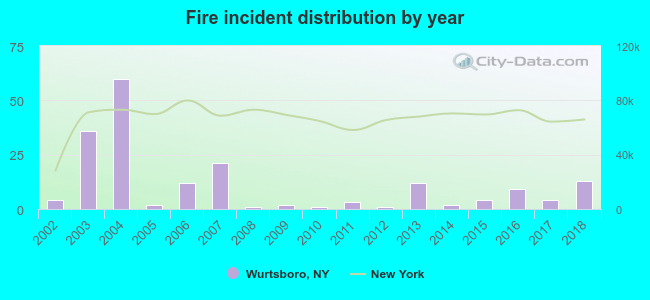 According to the data from the years 2002 - 2018 the average number of fires per year is 11. The highest number of fires - 60 took place in 2004, and the least - 1 in 2008. The data has a growing trend.
 37.4% incidents where reported in the morning and 62.6% in the evening. The most fires (17.6%) took place on Friday, and the least (11.2%) on Wednesday.
 Based on the 187 reports from years 2002 - 2018 most fires (18.7%) took place during April, and the least (4.8%) in February.
 Out of all 1,637 cases reported during the years 2002 - 2018, the most belonged to the categories: Rescue & EMS (31.5%), Hazardous Condition (30.8%), and Fire (11.4%).
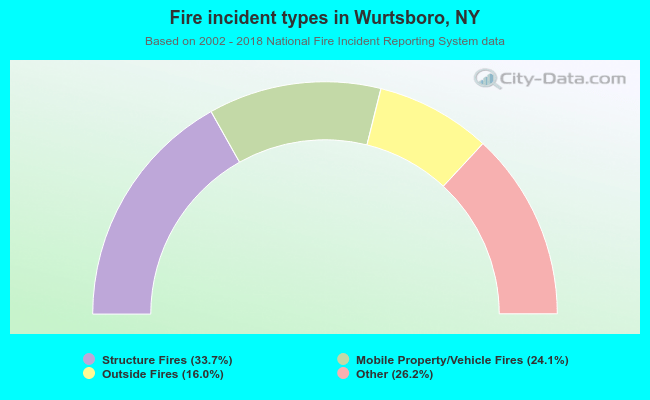 When looking into fire subcategories, the most reports belonged to: Structure Fires (33.7%), and Other (26.2%).