| Fire incidents reported |
|---|
| Sreet name | Count |
|---|
| GLEN WILD RD | 26 | | EAST POND ROAD | 16 | | ROSEMOND RD | 16 | | RIVER RD | 14 | | BROADWAY | 12 | | LAKE HOUSE RD | 12 | | MOUNTAINDALE RD | 12 | | OLD FALLS RD | 10 | | CHURCH RD | 8 | | CAUTHERS LN | 6 | | OLYMPIC HILL RD | 6 | | UNKNOWN | 6 | | WORTZMAN RD | 6 | | DAIRYLAND RD | 4 | | DAVOS POINTE | 4 | | DAVOS ROAD | 4 | | EAST POND RD | 4 | | EDELWEIS DR | 4 | | FOX RUN RD | 4 | | GREEN AVE | 4 | | HIDEAWAY DR | 4 | | HIGHLAND AVE | 4 | | MAIN ST | 4 | | MAPLE AVE | 4 | | MOUNTAINDALE & GLENWILD | 4 |
| | | Fire incidents reported |
|---|
| Sreet name | Count |
|---|
| NOVOGRODSKY RD | 4 | | POST HILL RD | 4 | | RIVER RD | 4 | | ROOSEVELT AVE | 4 | | TAYLOR RD | 4 | | ZEMATT COURT | 4 | | ALPINE DR | 2 | | BERNE COURT | 2 | | BROADWAY BLVD | 2 | | CAMP SQUIRE | 2 | | CAUTHERS RD | 2 | | CHURCH ROAD | 2 | | COUNTRY GARDENS | 2 | | COUNTY RD. 56 RD | 2 | | COUNTY ROAD 53 | 2 | | DAIRYLAND RD | 2 | | DENNISON HILL EXT | 2 | | DIANE BLVD | 2 | | FALLSBURG FIRE DEPT. | 2 | | GLENWILD RD | 2 | | GREEN ST | 2 | | GREENFIELD RD | 2 | | HIGHLAND AVE | 2 | | HIGHLAND AVE. | 2 | | |
|
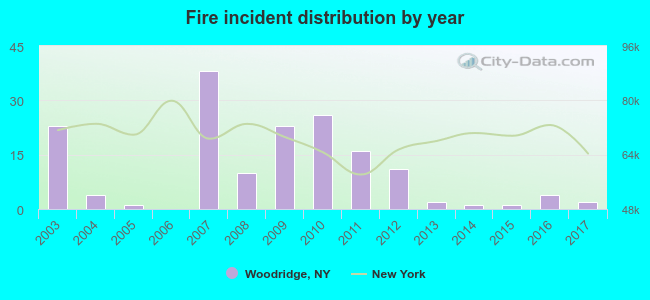 According to the data from the years 2003 - 2017 the average number of fires per year is 11. The highest number of fires - 38 took place in 2007, and the least - 0 in 2006. The data has a dropping trend.
 37.7% incidents where reported in the morning and 62.3% in the evening. The most fires (19.1%) took place on Sunday, and the least (9.3%) on Saturday.
 Based on the 162 reports from years 2003 - 2017 most fires (15.4%) took place during July, and the least (3.7%) in December.
 Out of all 631 cases reported during the years 2003 - 2017, the most belonged to the categories: Hazardous Condition (29.0%), Fire (25.7%), and False Alarm (15.1%).
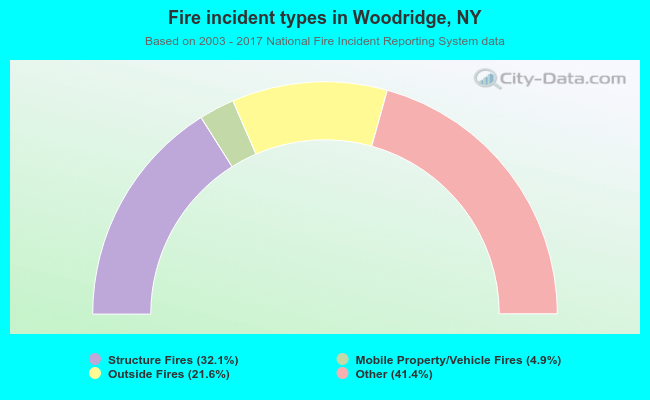 When looking into fire subcategories, the most reports belonged to: Other (41.4%), and Structure Fires (32.1%).