Webster: Fire Incidents, New York (NY)
Where are fire incidents reported in Webster, NY
Something went wrong! Please refresh the page.
| Fire incidents reported | |
|---|---|
| Sreet name | Count |
| RIDGE RD | 226 |
| HOLT ROAD | 94 |
| HOLT RD | 90 |
| LAKE RD | 80 |
| EMPIRE BL | 78 |
| RIDGE ROAD | 72 |
| KRIEGER RD | 64 |
| KRIEGER ROAD | 56 |
| GRAVEL RD | 54 |
| PLANK RD | 48 |
| KLEM RD | 46 |
| PHILLIPS ROAD | 42 |
| STATE RD | 42 |
| COUNTRY MANOR WAY | 40 |
| FIVE MILE LINE RD | 40 |
| WEBSTER RD | 40 |
| PHILLIPS RD | 34 |
| BAY RD | 32 |
| DEWITT RD | 32 |
| EMPIRE BLVD | 32 |
| SALT RD | 32 |
| SALT ROAD | 30 |
| WEBSTER MANOR DR | 30 |
| BASKET RD | 28 |
| LAKE ROAD | 28 |
| HARD RD | 24 |
| SCHLEGEL ROAD | 24 |
| RIDGE RD | 22 |
| SOUTH AV | 22 |
| BASKET RD | 20 |
| Other | 709 |
2002 - 2018 National Fire Incident Reporting System (NFIRS) incidents
- Incident types reported to NFIRS in Webster, NY
- 8,20440.2%Rescue & EMS
- 4,90124.0%Hazardous Condition
- 2,21110.8%Fire
- 2,17610.7%False Alarm
- 1,4527.1%Good Intent Call
- 1,2866.3%Service Call
- 1330.7%Severe Weather
- 500.2%Overpressure Rupture
- Fire incident types reported to NFIRS in Webster, NY
- 1,06648.2%Structure Fires
- 80536.4%Outside Fires
- 22610.2%Mobile Property/Vehicle Fires
- 1145.2%Other
 Based on the data from the years 2002 - 2018 the average number of fire incidents per year is 130. The highest number of reported fires - 224 took place in 2007, and the least - 65 in 2010. The data has a dropping trend.
The average number of yearly fire incidents per 10k residents in Webster, NY compared to nearest cities:
(Note: Based on data for the last 3 years, including only cities with population 5,000 and above)
| Webster: | 200.8 |
| Penfield: | 21.2 |
| Walworth: | 17.6 |
| Ontario: | 27.3 |
| Irondequoit: | 10.0 |
| East Rochester: | 31.3 |
| Fairport: | 126.0 |
| Perinton: | 2.3 |
| Brighton: | 1.6 |
 The median response time based on all reported fire incidents is 6 minutes. This is higher compared to the New York median value.
The median response time in Webster, NY compared to nearest cities:
(Note: Based on data for all years, including only cities with at least 500 fire incidents)
| Webster: | 6 minutes |
| Penfield: | 7 minutes |
| Fairport: | 6 minutes |
| Pittsford: | 6 minutes |
| Rochester: | 4 minutes |
| Victor: | 6 minutes |
| Farmington: | 7 minutes |
| Spencerport: | 8 minutes |
| Hilton: | 5 minutes |
 According to the data from the years 2002 - 2018 the average number of fire-related yearly deaths is 0. The highest number of deaths - 3 took place in 2011, and the lowest - 0 in 2002. The data has a constant trend.
 According to the data from the years 2002 - 2018 the average number of fire-related yearly casualties is 3. The highest number of reported injuries - 11 took place in 2006, and the lowest - 0 in 2009. The data has a rising trend.
The average number of casualties per 1,000 fire incidents is 25. This indicator was the highest - 69 in 2006, and the lowest 0 in 2009. The trend for injuries per 1,000 fires is growing. Compared to the New York value the number of casualties per 1,000 incidents is much higher.
According to the data from the years 2002 - 2018 the average number of fire-related yearly casualties is 3. The highest number of reported injuries - 11 took place in 2006, and the lowest - 0 in 2009. The data has a rising trend.
The average number of casualties per 1,000 fire incidents is 25. This indicator was the highest - 69 in 2006, and the lowest 0 in 2009. The trend for injuries per 1,000 fires is growing. Compared to the New York value the number of casualties per 1,000 incidents is much higher.Casualties per 1,000 incidents in Webster, NY compared to nearest cities:
(Note: Based on data for all years, including only cities with at least 500 fire incidents)
| Webster: | 24.0 |
| Penfield: | 10.2 |
| Fairport: | 3.2 |
| Pittsford: | 1.8 |
| Rochester: | 29.6 |
| Victor: | 11.0 |
| Farmington: | 0.0 |
| Spencerport: | 19.7 |
| Hilton: | 22.9 |
 29.7% incidents where reported in the morning and 70.3% in the evening. The most fires (16.8%) took place on Saturday, and the least (13.0%) on Tuesday.
 Based on the 2,211 incident reports from years 2002 - 2018 most fires (10.5%) took place during June, and the least (6.4%) in January.
 Out of all 20,429 cases reported during the years 2002 - 2018, the most belonged to the categories: Rescue & EMS (40.2%), Hazardous Condition (24.0%), and Fire (10.8%).
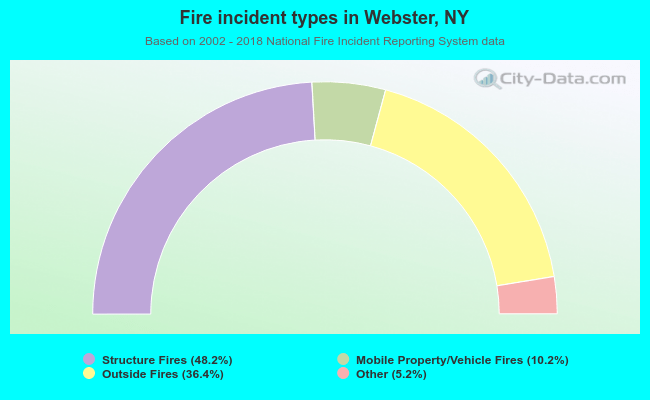 When looking into fire subcategories, the most reports belonged to: Structure Fires (48.2%), and Outside Fires (36.4%).