Watkins Glen: Fire Incidents, New York (NY)
Where are fire incidents reported in Watkins Glen, NY
Something went wrong! Please refresh the page.
|
| |||||||||||||||||||||||||||||||||||||||||||||||||||||||||||||||||||||||||||||||||||||||||||||||||||||||||||||
2003 - 2018 National Fire Incident Reporting System (NFIRS) incidents
- Incident types reported to NFIRS in Watkins Glen, NY
- 2,09655.6%Rescue & EMS
- 39910.6%Fire
- 3659.7%Hazardous Condition
- 3288.7%Service Call
- 2947.8%False Alarm
- 1443.8%Good Intent Call
- 1082.9%Severe Weather
- 240.6%Special Incident
- 100.3%Overpressure Rupture
- Fire incident types reported to NFIRS in Watkins Glen, NY
- 16842.1%Structure Fires
- 14736.8%Outside Fires
- 4611.5%Mobile Property/Vehicle Fires
- 389.5%Other
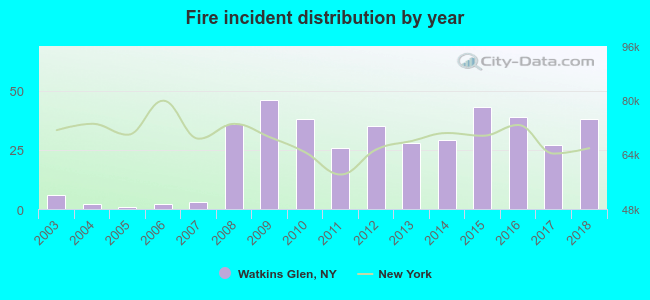 Based on the data from the years 2003 - 2018 the average number of fire incidents per year is 25. The highest number of reported fires - 46 took place in 2009, and the least - 1 in 2005. The data has a growing trend.
 Based on the reports from the years 2003 - 2018 the average number of fire-related yearly casualties is 1. The highest number of reported casualties - 3 took place in 2008, and the lowest - 0 in 2003. The data has a constant trend.
 31.3% incidents where reported in the morning and 68.7% in the evening. The most fires (18.8%) took place on Saturday, and the least (11.0%) on Monday.
 According to the 399 incident reports from years 2003 - 2018 most fires (21.3%) took place during August, and the least (4.5%) in February.
 Out of all 3,768 cases reported during the years 2003 - 2018, the most belonged to the categories: Rescue & EMS (55.6%), Fire (10.6%), and Hazardous Condition (9.7%).
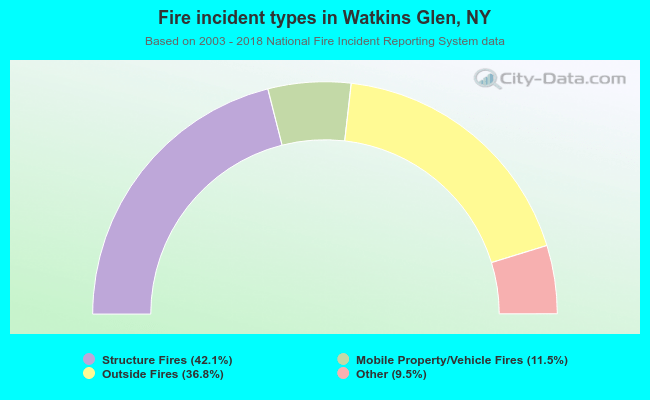 When looking into fire subcategories, the most incidents belonged to: Structure Fires (42.1%), and Outside Fires (36.8%).