Wallkill: Fire Incidents, New York (NY)
Where are fire incidents reported in Wallkill, NY
Something went wrong! Please refresh the page.
|
| |||||||||||||||||||||||||||||||||||||||||||||||||||||||||||||||||||||||||||||||||||||||||||||||||||||||||||||
2002 - 2018 National Fire Incident Reporting System (NFIRS) incidents
- Incident types reported to NFIRS in Wallkill, NY
- 60128.6%Rescue & EMS
- 50924.2%Hazardous Condition
- 38018.1%Fire
- 27813.2%False Alarm
- 1728.2%Service Call
- 1497.1%Good Intent Call
- 70.3%Severe Weather
- Fire incident types reported to NFIRS in Wallkill, NY
- 22358.7%Structure Fires
- 7218.9%Outside Fires
- 5414.2%Mobile Property/Vehicle Fires
- 318.2%Other
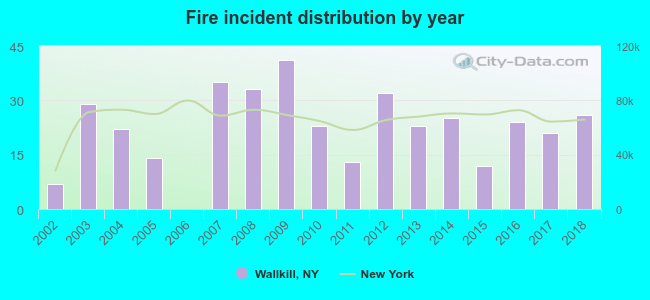 According to the data from the years 2002 - 2018 the average number of fires per year is 22. The highest number of reported fire incidents - 41 took place in 2009, and the least - 0 in 2006. The data has a growing trend.
 35.3% incidents where reported in the morning and 64.7% in the evening. The most fires (17.4%) took place on Saturday, and the least (11.1%) on Tuesday.
 According to the 380 reports from years 2002 - 2018 most fires (13.2%) took place during April, and the least (4.2%) in September.
 Out of all 2,099 cases reported during the years 2002 - 2018, the most belonged to the categories: Rescue & EMS (28.6%), Hazardous Condition (24.2%), and Fire (18.1%).
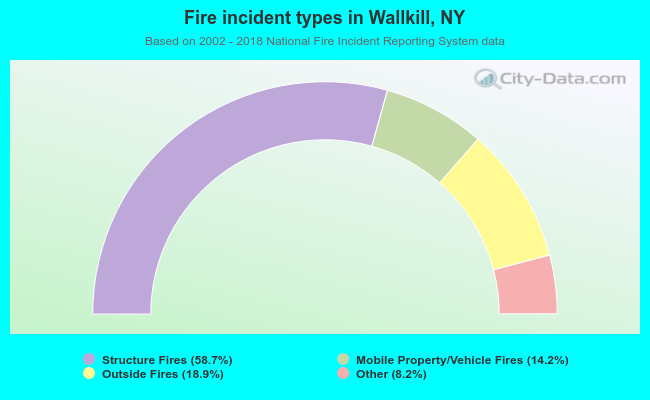 When looking into fire subcategories, the most reports belonged to: Structure Fires (58.7%), and Outside Fires (18.9%).