| Fire incidents reported |
|---|
| Sreet name | Count |
|---|
| RT 52 | 12 | | UPPER MOUNTAIN RD | 10 | | 52 RT | 8 | | MARL ROAD | 8 | | ROUTE 52 | 8 | | WALKER VALLEY FIREHOUSE | 8 | | BURLINGHAM RD | 6 | | INDIAN SPRINGS RD | 6 | | MARL RD | 6 | | OREGON TRAIL | 6 | | RT. 52 | 6 | | UPPER MT RD | 6 | | ARROWHEAD RD | 4 | | CHURCH RD | 4 | | FRONTIER DR | 4 | | MARL RD | 4 | | OLD TOWN RD | 4 | | OLD TOWN RD | 4 | | QUANNACUT RD | 4 | | RED BARN RD | 4 | | 1053 BURLINGHAM ROAD | 2 | | 135 BASEL ROAD | 2 | | 16 CHURCH ROAD | 2 | | 277 OREGON TRAIL | 2 | | 29 MARL ROAD | 2 |
| | | Fire incidents reported |
|---|
| Sreet name | Count |
|---|
| 47 WEED ROAD | 2 | | 78 QUANNACUT ROAD | 2 | | 86 MARL ROAD | 2 | | BASIL RD | 2 | | BERME RD | 2 | | BOYCE RD | 2 | | BURLINGHAM RD | 2 | | CHURCH ROAD | 2 | | CRANSVILLE RD | 2 | | DASCHNER LANE | 2 | | DASHNER LN | 2 | | FRONTIER DR | 2 | | FRONTIER DRIVE | 2 | | GROSS | 2 | | GROSSI LN | 2 | | HOWE LN | 2 | | INDIAN TRAIL | 2 | | IRISH CAPE RD | 2 | | JOHNS ESTATE ROAD | 2 | | LAKE SHORE DR. | 2 | | LAKESHORE DRIVE | 2 | | LAKEWOOD DR | 2 | | MANDEL RD | 2 | | NEW PROSPECT | 2 | | |
|
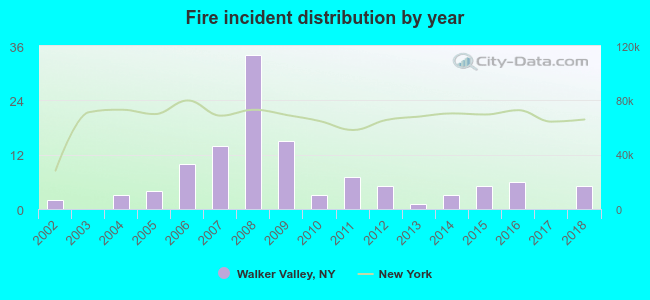 According to the data from the years 2002 - 2018 the average number of fires per year is 7. The highest number of reported fire incidents - 34 took place in 2008, and the least - 0 in 2003. The data has a growing trend.
 35.0% incidents where reported in the morning and 65.0% in the evening. The most fires (19.7%) took place on Friday, and the least (9.4%) on Thursday.
 According to the 117 reports from years 2002 - 2018 most fires (18.8%) took place during March, and the least (1.7%) in October.
 Out of all 244 cases reported during the years 2002 - 2018, the most belonged to the categories: Fire (48.0%), Rescue & EMS (31.6%), and Overpressure Rupture (7.8%).
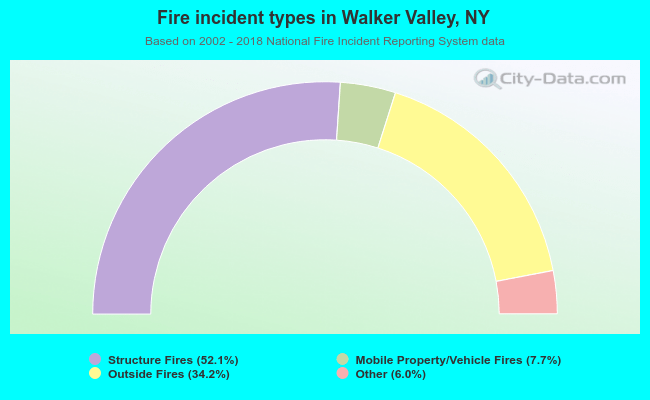 When looking into fire subcategories, the most reports belonged to: Structure Fires (52.1%), and Outside Fires (34.2%).