Waianae: Fire Incidents, Hawaii (HI)
Where are fire incidents reported in Waianae, HI
Something went wrong! Please refresh the page.
| Fire incidents reported | |
|---|---|
| Sreet name | Count |
| FARRINGTON HWY | 3,930 |
| WAIANAE VALLEY RD | 462 |
| PAAKEA RD | 440 |
| HAKIMO RD | 366 |
| ALA HEMA ST | 262 |
| LUALUALEI HMSTD RD | 260 |
| NANAKULI AVE | 256 |
| KULAAUPUNI ST | 254 |
| KILI DR | 230 |
| HELELUA ST | 194 |
| ALA AKAU ST | 178 |
| PLANTATION RD | 178 |
| MAKAHA VALLEY RD | 146 |
| KAUKAMA RD | 138 |
| MAILIILII RD | 126 |
| MCARTHUR ST | 124 |
| HALEAKALA AVE | 108 |
| KAUKAMANA RD | 102 |
| MANO AVE | 100 |
| ILIILI RD | 98 |
| ALA NAAUAO PL | 94 |
| LEIHOKU ST | 94 |
| HALEAHI RD | 84 |
| HALONA RD | 84 |
| LUALUALEI NAVAL RD | 84 |
| PUUHULU RD | 80 |
| KUWALE RD | 76 |
| PAHEEHEE RD | 74 |
| PUHAWAI RD | 72 |
| LAHAINA ST | 68 |
2003 - 2018 National Fire Incident Reporting System (NFIRS) incidents
- Incident types reported to NFIRS in Waianae, HI
- 10,01543.5%Rescue & EMS
- 5,85525.4%Fire
- 3,97417.3%Good Intent Call
- 1,5706.8%Hazardous Condition
- 1,1324.9%Service Call
- 4662.0%False Alarm
- Fire incident types reported to NFIRS in Waianae, HI
- 4,18871.5%Outside Fires
- 1,08918.6%Mobile Property/Vehicle Fires
- 5699.7%Structure Fires
- 90.2%Other
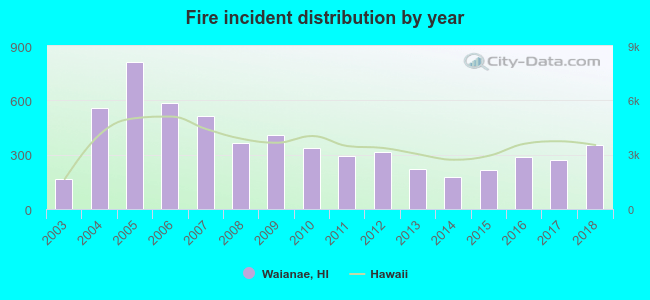 Based on the data from the years 2003 - 2018 the average number of fires per year is 366. The highest number of fire incidents - 810 took place in 2005, and the least - 165 in 2003. The data has a growing trend.
The average number of yearly fire incidents per 10k residents in Waianae, HI compared to nearest cities:
(Note: Based on data for the last 3 years, including only cities with population 5,000 and above)
| Waianae: | 229.7 |
| Maili: | 12.6 |
| Makaha: | 25.0 |
| Nanakuli: | 7.6 |
| Makakilo: | 2.7 |
| Kapolei: | 85.2 |
| Mililani Town: | 6.3 |
| Wahiawa: | 36.5 |
| Waipahu: | 36.5 |
 The median response time based on all reported fire incidents is 7 minutes. This is about the same as the state median value.
The median response time in Waianae, HI compared to nearest cities:
(Note: Based on data for all years, including only cities with at least 500 fire incidents)
| Waianae: | 7 minutes |
| Waialua: | 10 minutes |
| Kapolei: | 7 minutes |
| Mililani Town: | 6 minutes |
| Haleiwa: | 7 minutes |
| Wahiawa: | 6 minutes |
| Waipahu: | 7 minutes |
| Pearl City: | 7 minutes |
| Ewa Beach: | 7 minutes |
 According to the reports from the years 2003 - 2018 the average number of fire-related casualties per year is 1. The highest number of casualties - 2 took place in 2010, and the lowest - 0 in 2003. The data has a rising trend.
The average number of casualties per 1,000 fires is 1. This indicator was the highest - 6 in 2010, and the lowest 0 in 2003. The trend for casualties per 1,000 incidents is growing. Compared to the state value the number of casualties per 1,000 fire incidents is much lower.
According to the reports from the years 2003 - 2018 the average number of fire-related casualties per year is 1. The highest number of casualties - 2 took place in 2010, and the lowest - 0 in 2003. The data has a rising trend.
The average number of casualties per 1,000 fires is 1. This indicator was the highest - 6 in 2010, and the lowest 0 in 2003. The trend for casualties per 1,000 incidents is growing. Compared to the state value the number of casualties per 1,000 fire incidents is much lower.Casualties per 1,000 incidents in Waianae, HI compared to nearest cities:
(Note: Based on data for all years, including only cities with at least 500 fire incidents)
| Waianae: | 1.4 |
| Waialua: | 2.6 |
| Kapolei: | 6.3 |
| Mililani Town: | 6.9 |
| Haleiwa: | 5.4 |
| Wahiawa: | 8.7 |
| Waipahu: | 11.4 |
| Pearl City: | 12.2 |
| Ewa Beach: | 8.1 |
 44.0% incidents where reported in the morning and 56.0% in the evening. The most fires (15.3%) took place on Tuesday, and the least (13.5%) on Thursday.
 Based on the 5,855 incident reports from years 2003 - 2018 most fires (13.0%) took place during July, and the least (6.1%) in November.
 Out of all 23,018 cases reported during the years 2003 - 2018, the most belonged to the categories: Rescue & EMS (43.5%), Fire (25.4%), and Good Intent Call (17.3%).
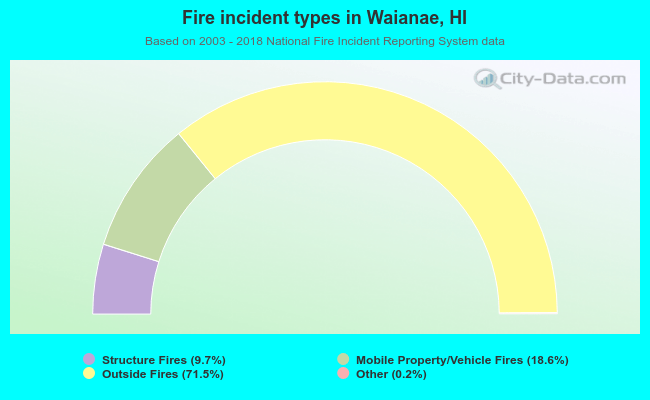 When looking into fire subcategories, the most incidents belonged to: Outside Fires (71.5%), and Mobile Property/Vehicle Fires (18.6%).