Thiells: Fire Incidents, New York (NY)
Where are fire incidents reported in Thiells, NY
Something went wrong! Please refresh the page.
|
| |||||||||||||||||||||||||||||||||||||||||||||||||||||||||||||||||||||||||||||||||||||||||||||||||||||||||||||
2002 - 2016 National Fire Incident Reporting System (NFIRS) incidents
- Incident types reported to NFIRS in Thiells, NY
- 21429.8%Hazardous Condition
- 17724.6%False Alarm
- 15521.6%Fire
- 9112.7%Good Intent Call
- 527.2%Service Call
- 283.9%Rescue & EMS
- 20.3%Severe Weather
- Fire incident types reported to NFIRS in Thiells, NY
- 8856.8%Structure Fires
- 3925.2%Outside Fires
- 2616.8%Mobile Property/Vehicle Fires
- 21.3%Other
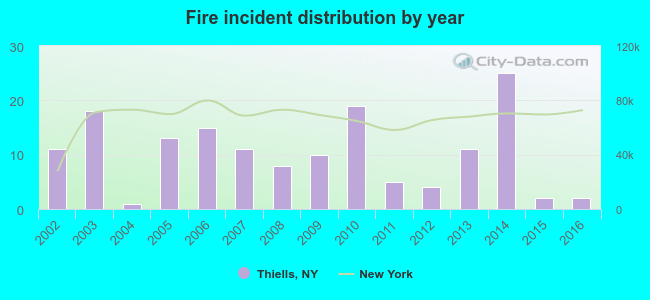 According to the data from the years 2002 - 2016 the average number of fires per year is 10. The highest number of reported fire incidents - 25 took place in 2014, and the least - 1 in 2004. The data has a decreasing trend.
The average number of yearly fire incidents per 10k residents in Thiells, NY compared to nearest cities:
(Note: Based on data for the last 3 years, including only cities with population 5,000 and above)
| Thiells: | 4.0 |
| West Haverstraw: | 7.4 |
| Stony Point: | 17.0 |
| Mount Ivy: | 1.5 |
| Haverstraw: | 40.0 |
| New City: | 19.5 |
| New Hempstead: | 30.8 |
| New Square: | 16.5 |
| Wesley Hills: | 31.0 |

 30.3% incidents where reported in the morning and 69.7% in the evening. The most fires (20.6%) took place on Wednesday, and the least (9.7%) on Sunday.
 According to the 155 reports from years 2002 - 2016 most fires (12.3%) took place during July, and the least (3.9%) in March.
 Out of all 719 cases reported during the years 2002 - 2016, the most belonged to the categories: Rescue & EMS (29.8%), Good Intent Call (24.6%), and Fire (21.6%).
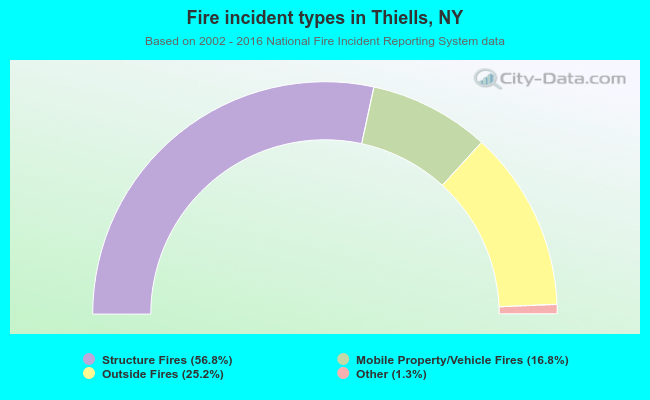 When looking into fire subcategories, the most reports belonged to: Structure Fires (56.8%), and Outside Fires (25.2%).