Sylvester: Fire Incidents, Georgia (GA)
Where are fire incidents reported in Sylvester, GA
Something went wrong! Please refresh the page.
|
| |||||||||||||||||||||||||||||||||||||||||||||||||||||||||||||||||||||||||||||||||||||||||||||||||||||||||||||
| Other | 506 | |||||||||||||||||||||||||||||||||||||||||||||||||||||||||||||||||||||||||||||||||||||||||||||||||||||||||||||
2002 - 2018 National Fire Incident Reporting System (NFIRS) incidents
- Incident types reported to NFIRS in Sylvester, GA
- 1,64831.3%Fire
- 1,31124.9%Rescue & EMS
- 94517.9%Good Intent Call
- 69913.3%Hazardous Condition
- 2745.2%False Alarm
- 1943.7%Service Call
- 1903.6%Severe Weather
- 70.1%Overpressure Rupture
- Fire incident types reported to NFIRS in Sylvester, GA
- 88953.9%Outside Fires
- 41725.3%Structure Fires
- 29618.0%Mobile Property/Vehicle Fires
- 462.8%Other
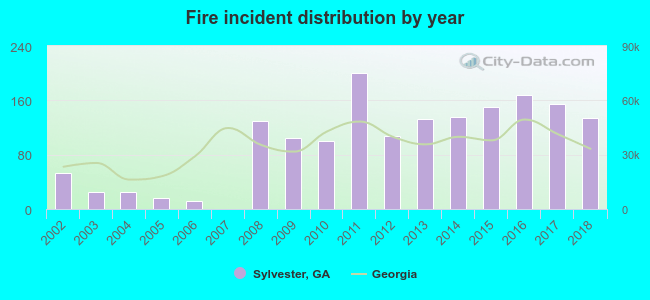 Based on the data from the years 2002 - 2018 the average number of fires per year is 97. The highest number of reported fires - 200 took place in 2011, and the least - 0 in 2007. The data has a rising trend.
The average number of yearly fire incidents per 10k residents in Sylvester, GA compared to nearest cities:
(Note: Based on data for the last 3 years, including only cities with population 5,000 and above)
| Sylvester: | 249.8 |
| Albany: | 75.1 |
| Tifton: | 107.4 |
| Moultrie: | 179.5 |
| Cordele: | 179.8 |
| Camilla: | 135.1 |
| Adel: | 165.4 |
| Fitzgerald: | 108.1 |
| Americus: | 113.4 |
 The median response time based on all reported fire incidents is 8 minutes. This is higher than the state median value.
The median response time in Sylvester, GA compared to nearest cities:
(Note: Based on data for all years, including only cities with at least 500 fire incidents)
| Sylvester: | 8 minutes |
| Ashburn: | 4 minutes |
| Albany: | 5 minutes |
| Tifton: | 6 minutes |
| Norman Park: | 8 minutes |
| Baconton: | 8 minutes |
| Leesburg: | 6 minutes |
| Moultrie: | 5 minutes |
| Cordele: | 5 minutes |
 24.7% incidents where reported in the morning and 75.3% in the evening. The most fires (16.7%) took place on Saturday, and the least (13.0%) on Tuesday.
 According to the 1,648 incident reports from years 2002 - 2018 most fires (12.1%) took place during January, and the least (4.5%) in December.
 Out of all 5,270 cases reported during the years 2002 - 2018, the most belonged to the categories: Fire (31.3%), Rescue & EMS (24.9%), and Good Intent Call (17.9%).
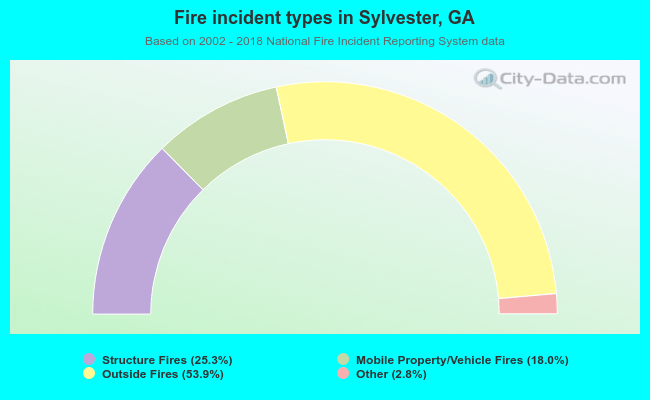 When looking into fire subcategories, the most incidents belonged to: Outside Fires (53.9%), and Structure Fires (25.3%).