Swanzey: Fire Incidents, New Hampshire (NH)
Where are fire incidents reported in Swanzey, NH
Something went wrong! Please refresh the page.
|
| |||||||||||||||||||||||||||||||||||||||||||||||||||||||||||||||||||||||||||||||||||||||||||||||||||||||||||||
2002 - 2018 National Fire Incident Reporting System (NFIRS) incidents
- Incident types reported to NFIRS in Swanzey, NH
- 2,53169.2%Rescue & EMS
- 3108.5%Fire
- 2416.6%Hazardous Condition
- 1925.3%False Alarm
- 1855.1%Service Call
- 1464.0%Good Intent Call
- 411.1%Severe Weather
- 60.2%Overpressure Rupture
- Fire incident types reported to NFIRS in Swanzey, NH
- 22873.5%Structure Fires
- 3310.6%Outside Fires
- 268.4%Mobile Property/Vehicle Fires
- 237.4%Other
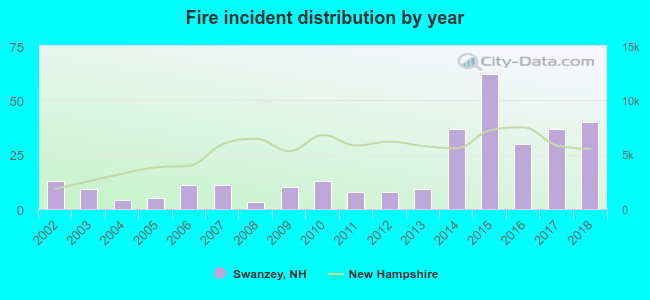 Based on the data from the years 2002 - 2018 the average number of fires per year is 18. The highest number of fire incidents - 62 took place in 2015, and the least - 3 in 2008. The data has an increasing trend.
The average number of yearly fire incidents per 10k residents in Swanzey, NH compared to nearest cities:
(Note: Based on data for the last 3 years, including only cities with population 5,000 and above)
| Swanzey: | 49.3 |
| Keene: | 43.1 |
| Rindge: | 53.8 |
| New Ipswich: | 59.5 |

 37.7% incidents where reported in the morning and 62.3% in the evening. The most fires (17.1%) took place on Monday, and the least (10.6%) on Thursday.
 According to the 310 reports from years 2002 - 2018 most fires (13.5%) took place during January, and the least (4.8%) in July.
 Out of all 3,655 cases reported during the years 2002 - 2018, the most belonged to the categories: Rescue & EMS (69.2%), Fire (8.5%), and Hazardous Condition (6.6%).
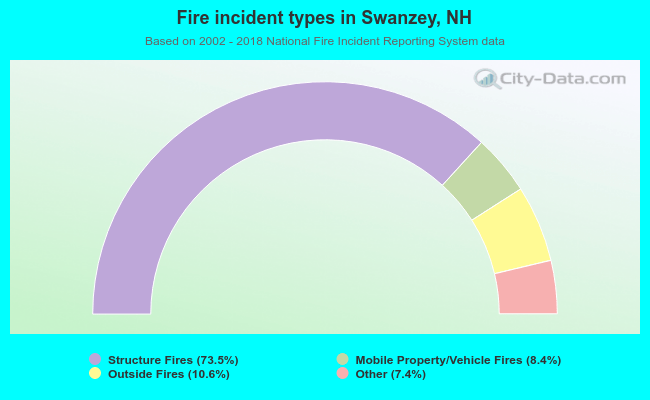 When looking into fire subcategories, the most incidents belonged to: Structure Fires (73.5%), and Outside Fires (10.6%).