Susanville: Fire Incidents, California (CA)
Where are fire incidents reported in Susanville, CA
Something went wrong! Please refresh the page.
| Fire incidents reported | |
|---|---|
| Sreet name | Count |
| MAIN ST | 198 |
| CENTER RD | 66 |
| RIVERSIDE DR | 62 |
| JOHNSTONVILLE RD | 48 |
| FIRST ST | 36 |
| FOURTH ST | 36 |
| RICHMOND RD | 34 |
| RICHMOND ROAD | 34 |
| ASH ST | 32 |
| NORTH ST | 32 |
| HALL ST | 30 |
| RICE CANYON RD | 24 |
| LIMONERIA | 22 |
| SPRING ST | 22 |
| HWY 36 | 20 |
| RUSSELL AVE | 20 |
| CAMERON WAY | 18 |
| FAIRFIELD | 18 |
| MESA ST | 18 |
| PAIUTE LN | 16 |
| THIRD ST | 16 |
| HIGHWAY 36 | 14 |
| PLUMAS ST | 14 |
| SHASTA ST | 14 |
| UPLAND | 14 |
| WEATHERLOW ST | 14 |
| ALEXANDER AVE | 12 |
| ARNOLD ST | 12 |
| HIGHWAY 395 | 12 |
| HWY 395 | 12 |
| Other | 163 |
2005 - 2018 National Fire Incident Reporting System (NFIRS) incidents
- Incident types reported to NFIRS in Susanville, CA
- 3,39751.4%Rescue & EMS
- 1,08316.4%Fire
- 70410.6%Hazardous Condition
- 4957.5%Service Call
- 4777.2%Good Intent Call
- 4006.1%False Alarm
- 310.5%Special Incident
- 200.3%Severe Weather
- Fire incident types reported to NFIRS in Susanville, CA
- 53349.2%Structure Fires
- 39136.1%Outside Fires
- 968.9%Mobile Property/Vehicle Fires
- 635.8%Other
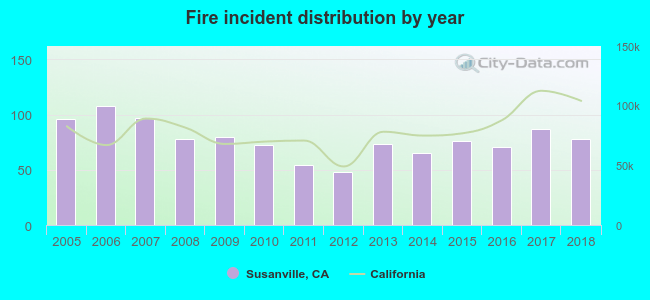 Based on the data from the years 2005 - 2018 the average number of fires per year is 77. The highest number of reported fires - 108 took place in 2006, and the least - 48 in 2012. The data has a dropping trend.
The average number of yearly fire incidents per 10k residents in Susanville, CA compared to nearest cities:
(Note: Based on data for the last 3 years, including only cities with population 5,000 and above)
| Susanville: | 50.6 |
 The median response time based on all reported fire incidents is 4 minutes. This is lower compared to the California median value.
The median response time in Susanville, CA compared to nearest cities:
(Note: Based on data for all years, including only cities with at least 500 fire incidents)
| Susanville: | 4 minutes |
 According to the data from the years 2005 - 2018 the average number of fire-related casualties per year is 1. The highest number of casualties - 4 took place in 2013, and the lowest - 0 in 2006. The data has a rising trend.
The average number of casualties per 1,000 fire incidents is 14. This indicator was the highest - 55 in 2013, and the lowest 0 in 2006. The trend for casualties per 1,000 fire incidents is rising. Compared to the California value the number of casualties per 1,000 fire incidents is much higher.
According to the data from the years 2005 - 2018 the average number of fire-related casualties per year is 1. The highest number of casualties - 4 took place in 2013, and the lowest - 0 in 2006. The data has a rising trend.
The average number of casualties per 1,000 fire incidents is 14. This indicator was the highest - 55 in 2013, and the lowest 0 in 2006. The trend for casualties per 1,000 fire incidents is rising. Compared to the California value the number of casualties per 1,000 fire incidents is much higher.Casualties per 1,000 incidents in Susanville, CA compared to nearest cities:
(Note: Based on data for all years, including only cities with at least 500 fire incidents)
| Susanville: | 13.9 |
 32.4% incidents where reported in the morning and 67.6% in the evening. The most fires (16.5%) took place on Sunday, and the least (11.4%) on Friday.
 Based on the 1,083 fires from years 2005 - 2018 most fires (13.8%) took place during July, and the least (5.4%) in March.
 Out of all 6,611 cases reported during the years 2005 - 2018, the most belonged to the categories: Rescue & EMS (51.4%), Fire (16.4%), and Hazardous Condition (10.6%).
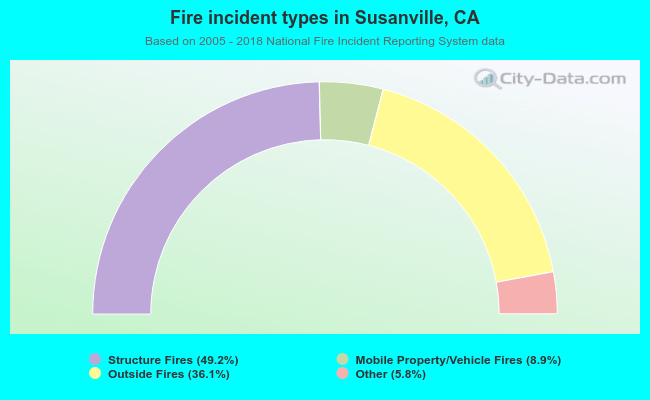 When looking into fire subcategories, the most incidents belonged to: Structure Fires (49.2%), and Outside Fires (36.1%).