Ripon: Fire Incidents, California (CA)
Where are fire incidents reported in Ripon, CA
Something went wrong! Please refresh the page.
|
| |||||||||||||||||||||||||||||||||||||||||||||||||||||||||||||||||||||||||||||||||||||||||||||||||||||||||||||
2006 - 2018 National Fire Incident Reporting System (NFIRS) incidents
- Incident types reported to NFIRS in Ripon, CA
- 4,35363.6%Rescue & EMS
- 79711.7%Good Intent Call
- 6118.9%Service Call
- 5838.5%Fire
- 2503.7%False Alarm
- 2343.4%Hazardous Condition
- Fire incident types reported to NFIRS in Ripon, CA
- 28348.5%Outside Fires
- 13423.0%Structure Fires
- 12421.3%Mobile Property/Vehicle Fires
- 427.2%Other
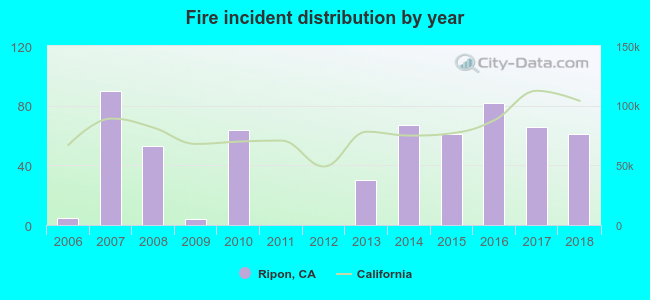 Based on the data from the years 2006 - 2018 the average number of fire incidents per year is 45. The highest number of fires - 90 took place in 2007, and the least - 0 in 2011. The data has a growing trend.
The average number of yearly fire incidents per 10k residents in Ripon, CA compared to nearest cities:
(Note: Based on data for the last 3 years, including only cities with population 5,000 and above)
| Ripon: | 46.5 |
| Salida: | 6.6 |
| Manteca: | 59.8 |
| Escalon: | 70.4 |
| Modesto: | 68.9 |
| Riverbank: | 32.8 |
| Lathrop: | 70.6 |
| Ceres: | 36.3 |
| Oakdale: | 39.2 |
 The median response time based on all reported fire incidents is 6 minutes. This is close to the California median value.
The median response time in Ripon, CA compared to nearest cities:
(Note: Based on data for all years, including only cities with at least 500 fire incidents)
| Ripon: | 6 minutes |
| Manteca: | 5 minutes |
| Modesto: | 5 minutes |
| Riverbank: | 6 minutes |
| Lathrop: | 6 minutes |
| Ceres: | 5 minutes |
| Oakdale: | 6 minutes |
| Tracy: | 7 minutes |
| Patterson: | 5 minutes |
 34.8% incidents where reported in the morning and 65.2% in the evening. The most fires (19.0%) took place on Monday, and the least (10.6%) on Tuesday.
 According to the 583 incident reports from years 2006 - 2018 most fires (14.8%) took place during June, and the least (3.6%) in February.
 Out of all 6,840 cases reported during the years 2006 - 2018, the most belonged to the categories: Rescue & EMS (63.6%), Good Intent Call (11.7%), and Service Call (8.9%).
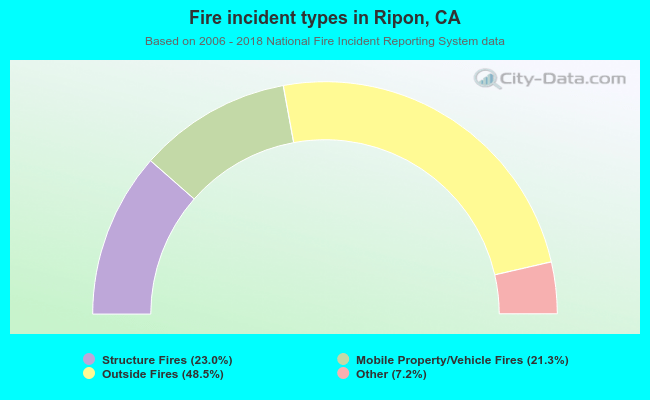 When looking into fire subcategories, the most reports belonged to: Outside Fires (48.5%), and Structure Fires (23.0%).