Pompey: Fire Incidents, New York (NY)
Where are fire incidents reported in Pompey, NY
Something went wrong! Please refresh the page.
|
| |||||||||||||||||||||||||||||||||||||||||||||||||||||||||||||||||||||||||||||||||||||||||||||||||||||||||||||
2002 - 2018 National Fire Incident Reporting System (NFIRS) incidents
- Incident types reported to NFIRS in Pompey, NY
- 13836.3%Fire
- 9825.8%Rescue & EMS
- 4712.4%Good Intent Call
- 4612.1%Hazardous Condition
- 266.8%Service Call
- 246.3%False Alarm
- 10.3%Severe Weather
- Fire incident types reported to NFIRS in Pompey, NY
- 10979.0%Structure Fires
- 1712.3%Outside Fires
- 64.3%Mobile Property/Vehicle Fires
- 64.3%Other
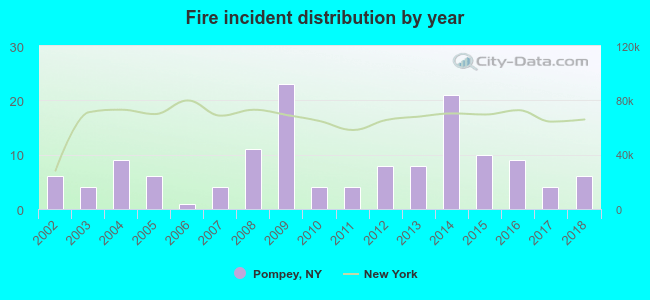 Based on the data from the years 2002 - 2018 the average number of fires per year is 8. The highest number of fire incidents - 23 took place in 2009, and the least - 1 in 2006. The data has a constant trend.
The average number of yearly fire incidents per 10k residents in Pompey, NY compared to nearest cities:
(Note: Based on data for the last 3 years, including only cities with population 5,000 and above)
| Pompey: | 8.9 |
| Chittenango: | 48.5 |
| De Witt: | 14.3 |
| Onondaga: | 3.9 |
| Syracuse: | 77.4 |
| Mattydale: | 63.1 |
| Solvay: | 38.7 |
| Fairmount: | 1.0 |
| North Syracuse: | 96.9 |

 31.9% incidents where reported in the morning and 68.1% in the evening. The most fires (21.0%) took place on Sunday, and the least (8.7%) on Wednesday.
 According to the 138 incident reports from years 2002 - 2018 most fires (13.8%) took place during July, and the least (2.9%) in June.
 Out of all 380 cases reported during the years 2002 - 2018, the most belonged to the categories: Fire (36.3%), Overpressure Rupture (25.8%), and Service Call (12.4%).
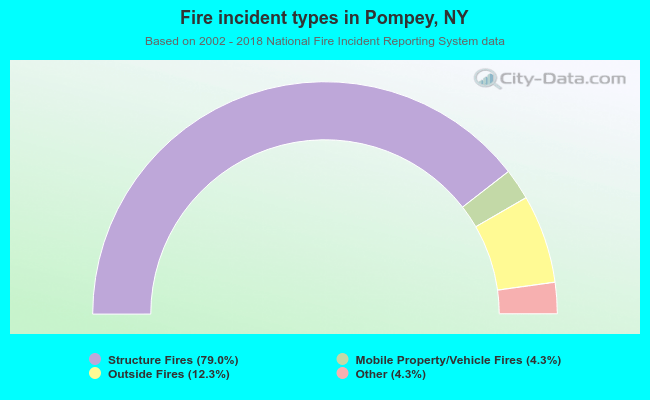 When looking into fire subcategories, the most incidents belonged to: Structure Fires (79.0%), and Outside Fires (12.3%).