| Fire incidents reported |
|---|
| Sreet name | Count |
|---|
| MAIN ST | 42 | | LAMSON RD | 36 | | M/A PHOENIX | 30 | | BRIDGE ST | 22 | | LOCK ST | 16 | | HUNTLEY RD | 14 | | PENDERGAST RD | 14 | | 481 RT | 12 | | KLINE RD | 12 | | LAMSON RD | 12 | | STATE ROUTE 481 HWY | 12 | | VOLNEY ST | 12 | | W BRIDGE ST | 12 | | 57 RT | 10 | | 6 RT | 10 | | CANAL RD | 10 | | COUNTY ROUTE 57 | 10 | | LAMSON ROAD | 10 | | RIVER RD | 10 | | STATE ROUTE 264 | 10 | | COUNTY LINE RD | 8 | | COUNTY ROUTE 12 | 8 | | COUNTY ROUTE 12 RT | 8 | | COUNTY ROUTE 57 RT | 8 | | COUNTY ROUTE 6 | 8 |
| | | Fire incidents reported |
|---|
| Sreet name | Count |
|---|
| JEFFERSON ST | 8 | | MAPLEHURST DR | 8 | | OSWEGO RD | 8 | | OSWEGO RD | 8 | | OSWEGO RIVER RD | 8 | | STATE ST | 8 | | 12 RT | 6 | | BANKRUPT RD | 6 | | BIDDLECUM RD | 6 | | CHESTNUT ST | 6 | | COUNTY ROUTE 57A | 6 | | CULVERT ST | 6 | | RABBIT LANE | 6 | | RIVEREDGE DR | 6 | | SMOKEY HOLLOW RD | 6 | | STATE ROUTE 264 RT | 6 | | STATE ROUTE 48 | 6 | | WASHER RD | 6 | | BRIDGE ST | 4 | | CAMP RD | 4 | | CENTER RD | 4 | | CHERRY ST | 4 | | CHESTNUT ST | 4 | | CLARKCREST DR | 4 | | COUNTY ROUTE 10 | 4 |
|
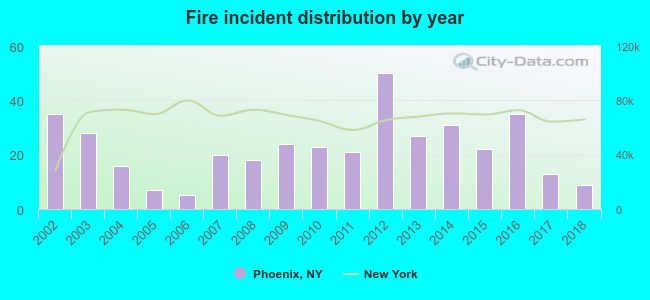 According to the data from the years 2002 - 2018 the average number of fire incidents per year is 23. The highest number of reported fire incidents - 50 took place in 2012, and the least - 5 in 2006. The data has a declining trend.
 36.5% incidents where reported in the morning and 63.5% in the evening. The most fires (18.5%) took place on Friday, and the least (11.2%) on Monday.
 Based on the 384 fires from years 2002 - 2018 most fires (12.5%) took place during April, and the least (3.9%) in October.
 Out of all 4,415 cases reported during the years 2002 - 2018, the most belonged to the categories: Overpressure Rupture (50.9%), Service Call (20.9%), and Rescue & EMS (9.3%).
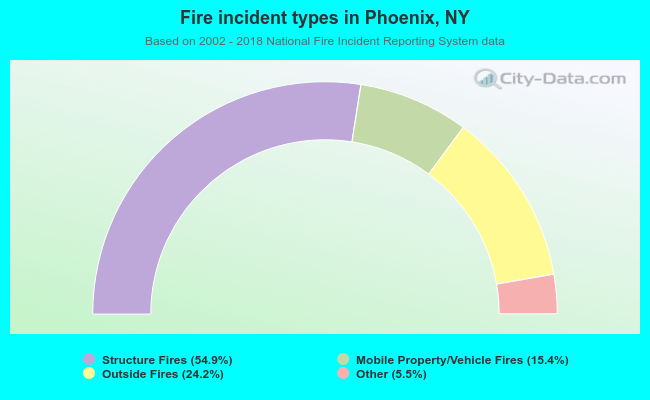 When looking into fire subcategories, the most incidents belonged to: Structure Fires (54.9%), and Outside Fires (24.2%).