| Fire incidents reported |
|---|
| Sreet name | Count |
|---|
| MAIN STREET | 30 | | STATE ROUTE 96 RT | 26 | | COUNTY ROAD 23 | 24 | | NEW YORK STATE THRUWAY | 24 | | STATE ROUTE 96 | 24 | | STATE ROUTE 488 | 20 | | NEW YORK STATE THRUWAY HWY | 16 | | MAIN ST | 14 | | GIFFORD RD | 12 | | NEW YORK STATE THRUWAY | 12 | | FORT HILL RD | 10 | | COUNTY RD 23 | 8 | | FISHER RD | 8 | | LESTER ROAD | 8 | | STATE ROUTE 88 | 8 | | CLIFTON STREET | 6 | | EAGLE STREET | 6 | | FALKEY ROAD | 6 | | FORT HILL ROAD | 6 | | GIFFORD ROAD | 6 | | GRIFFITH RD | 6 | | GRIFFITH ROAD | 6 | | MARY STREET | 6 | | MCBURNEY RD | 6 | | MELVIN HILL ROAD | 6 |
| | | Fire incidents reported |
|---|
| Sreet name | Count |
|---|
| MOTT RD | 6 | | SOUTH MARBLETOWN RD | 6 | | STATE ROUTE 14 RT | 6 | | WHITE RD | 6 | | 79 ONTARIO ST | 4 | | BANTA STREET | 4 | | BURNETT RD | 4 | | CHURCH | 4 | | COUNTY RD 6 | 4 | | CRESS RD | 4 | | EAST MAIN STREET | 4 | | GIFFORD RD | 4 | | JAY ST | 4 | | LESTER RD | 4 | | LESTER RD | 4 | | MAIN ST | 4 | | MARYLAND RD | 4 | | ONTARIO ST | 4 | | ONTARIO STREET | 4 | | PARK STREET | 4 | | RIDLEY RD | 4 | | RIDLEY ROAD | 4 | | ROCKERFELLER ROAD | 4 | | SOUTH MARBLE TOWN | 4 | | SOUTH MARBLETOWN RD | 4 |
|
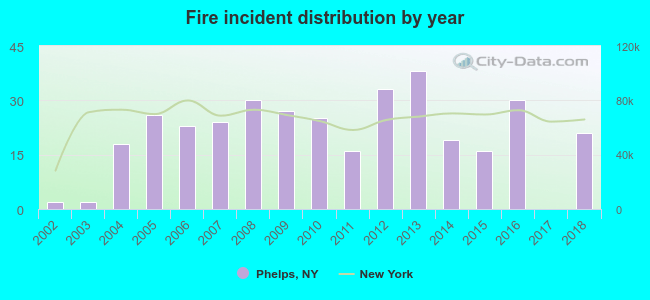 According to the data from the years 2002 - 2018 the average number of fires per year is 21. The highest number of reported fires - 38 took place in 2013, and the least - 0 in 2017. The data has a growing trend.
 32.0% incidents where reported in the morning and 68.0% in the evening. The most fires (17.4%) took place on Monday, and the least (10.9%) on Thursday.
 According to the 350 incident reports from years 2002 - 2018 most fires (14.9%) took place during April, and the least (3.1%) in October.
 Out of all 2,038 cases reported during the years 2002 - 2018, the most belonged to the categories: Hazardous Condition (29.2%), Rescue & EMS (25.2%), and Fire (17.2%).
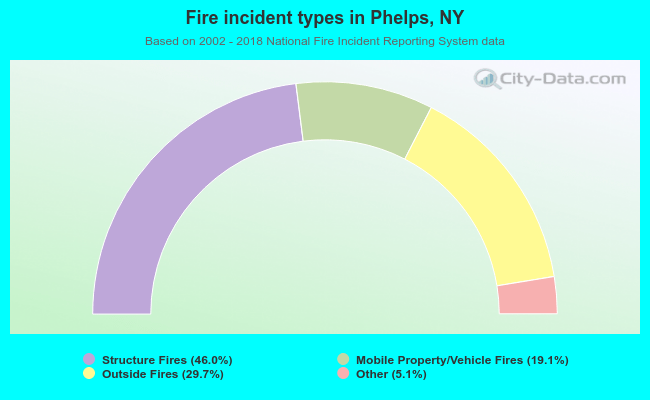 When looking into fire subcategories, the most incidents belonged to: Structure Fires (46.0%), and Outside Fires (29.7%).