Peru: Fire Incidents, New York (NY)
Where are fire incidents reported in Peru, NY
Something went wrong! Please refresh the page.
|
| |||||||||||||||||||||||||||||||||||||||||||||||||||||||||||||||||||||||||||||||||||||||||||||||||||||||||||||
2003 - 2018 National Fire Incident Reporting System (NFIRS) incidents
- Incident types reported to NFIRS in Peru, NY
- 1,24750.4%Rescue & EMS
- 40816.5%Hazardous Condition
- 29411.9%Good Intent Call
- 2349.5%Fire
- 1857.5%Service Call
- 773.1%False Alarm
- 301.2%Severe Weather
- Fire incident types reported to NFIRS in Peru, NY
- 11950.9%Structure Fires
- 7833.3%Outside Fires
- 3012.8%Mobile Property/Vehicle Fires
- 73.0%Other
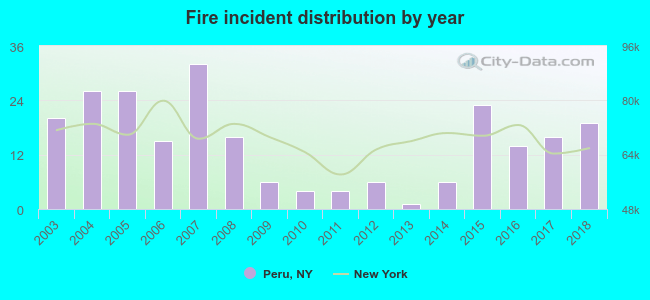 According to the data from the years 2003 - 2018 the average number of fires per year is 15. The highest number of reported fires - 32 took place in 2007, and the least - 1 in 2013. The data has a dropping trend.
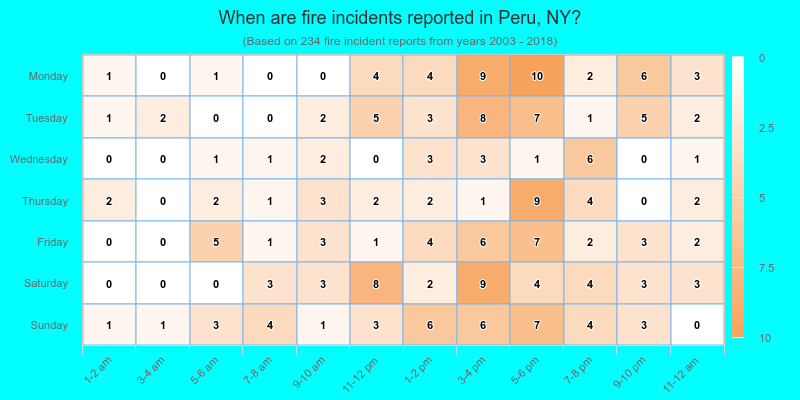
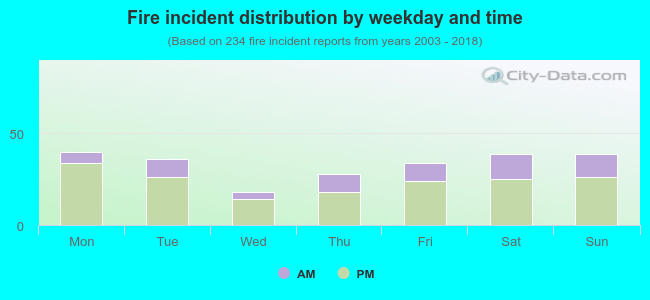 28.6% incidents where reported in the morning and 71.4% in the evening. The most fires (17.1%) took place on Monday, and the least (7.7%) on Wednesday.
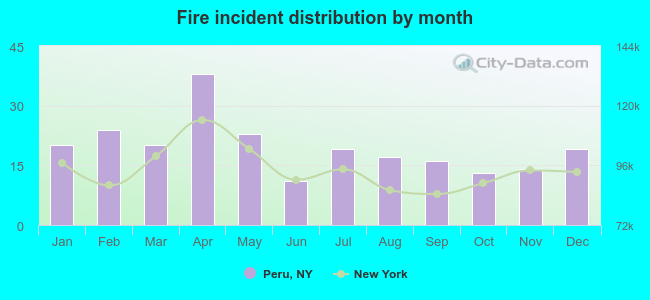 According to the 234 incident reports from years 2003 - 2018 most fires (16.2%) took place during April, and the least (4.7%) in June.
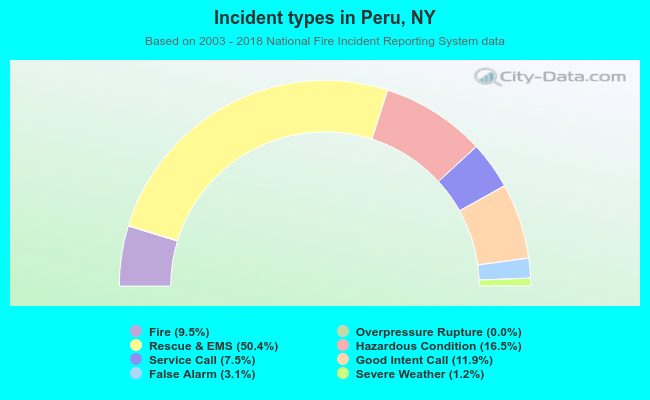 Out of all 2,476 cases reported during the years 2003 - 2018, the most belonged to the categories: Rescue & EMS (50.4%), Hazardous Condition (16.5%), and Good Intent Call (11.9%).
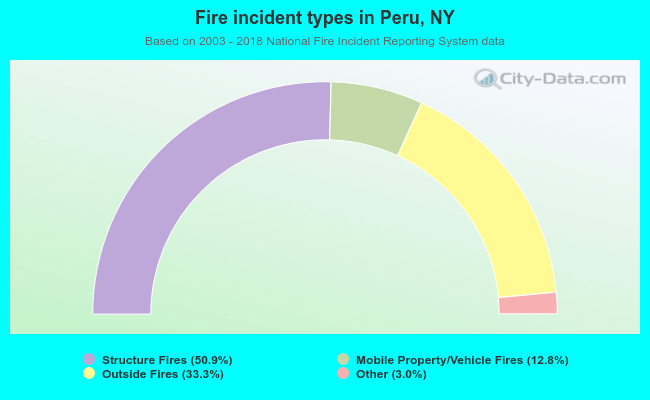 When looking into fire subcategories, the most incidents belonged to: Structure Fires (50.9%), and Outside Fires (33.3%).