Niskayuna: Fire Incidents, New York (NY)
Where are fire incidents reported in Niskayuna, NY
Something went wrong! Please refresh the page.
| Fire incidents reported | |
|---|---|
| Sreet name | Count |
| BALLTOWN RD | 228 |
| UNION ST | 136 |
| HILLSIDE AVE | 96 |
| VAN ANTWERP RD | 70 |
| NOTT ST | 50 |
| ROSENDALE RD | 42 |
| RIVER RD | 38 |
| AQUEDUCT RD | 36 |
| KNOLLS RD | 36 |
| TROY RD | 34 |
| TROY SCHENECTADY RD | 32 |
| BAKER AVE | 30 |
| CLIFTON PARK RD | 30 |
| PALMER AVE | 28 |
| REGENT ST | 24 |
| BROOKSHIRE DR | 22 |
| PEARSE RD | 22 |
| DEAN ST | 20 |
| EASTERN PKY | 20 |
| SHIRL LANE | 20 |
| MENLO PARK RD | 18 |
| PLUM ST | 18 |
| CORNELIUS AVE | 16 |
| PROVIDENCE AVE | 16 |
| LYNNWOOD DR | 14 |
| NISKAYUNA DR | 14 |
| ROSEHILL BLVD | 14 |
| GLEN EDDY DR | 12 |
| LEXINGTON PKY | 12 |
| LISHA KILL RD | 12 |
2002 - 2018 National Fire Incident Reporting System (NFIRS) incidents
- Incident types reported to NFIRS in Niskayuna, NY
- 10,94960.9%Rescue & EMS
- 1,91810.7%False Alarm
- 1,4328.0%Hazardous Condition
- 1,3887.7%Good Intent Call
- 1,1546.4%Service Call
- 1,0856.0%Fire
- 240.1%Overpressure Rupture
- Fire incident types reported to NFIRS in Niskayuna, NY
- 62557.6%Structure Fires
- 26924.8%Outside Fires
- 10810.0%Other
- 837.6%Mobile Property/Vehicle Fires
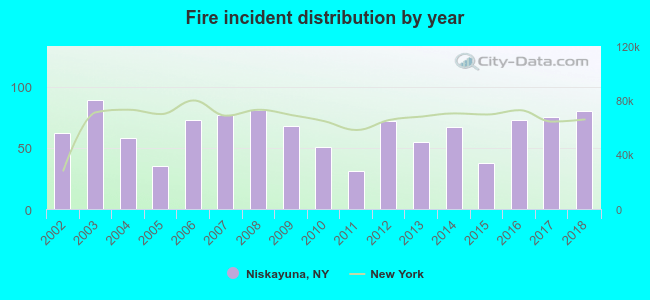 According to the data from the years 2002 - 2018 the average number of fire incidents per year is 64. The highest number of fires - 89 took place in 2003, and the least - 31 in 2011. The data has a rising trend.
 The median response time based on all reported fire incidents is 4 minutes. This is similar to the New York median value.
The median response time in Niskayuna, NY compared to nearest cities:
(Note: Based on data for all years, including only cities with at least 500 fire incidents)
| Niskayuna: | 4 minutes |
| Schenectady: | 4 minutes |
| Glenville: | 4 minutes |
| Clifton Park: | 6 minutes |
| Colonie: | 7 minutes |
| Halfmoon: | 6 minutes |
| Cohoes: | 4 minutes |
| Waterford: | 5 minutes |
| Mechanicville: | 5 minutes |
 Based on the data from the years 2002 - 2018 the average number of fire-related yearly casualties is 1. The highest number of injuries - 4 took place in 2006, and the lowest - 0 in 2005. The data has a declining trend.
The average number of casualties per 1,000 fire incidents is 12. This indicator was the highest - 55 in 2006, and the lowest 0 in 2005. The trend for casualties per 1,000 fire incidents is decreasing. Compared to the New York value the number of injuries per 1,000 fires is higher.
Based on the data from the years 2002 - 2018 the average number of fire-related yearly casualties is 1. The highest number of injuries - 4 took place in 2006, and the lowest - 0 in 2005. The data has a declining trend.
The average number of casualties per 1,000 fire incidents is 12. This indicator was the highest - 55 in 2006, and the lowest 0 in 2005. The trend for casualties per 1,000 fire incidents is decreasing. Compared to the New York value the number of injuries per 1,000 fires is higher.Casualties per 1,000 incidents in Niskayuna, NY compared to nearest cities:
(Note: Based on data for all years, including only cities with at least 500 fire incidents)
| Niskayuna: | 13.8 |
| Schenectady: | 11.2 |
| Glenville: | 2.2 |
| Clifton Park: | 6.7 |
| Colonie: | 2.6 |
| Halfmoon: | 6.8 |
| Cohoes: | 13.3 |
| Waterford: | 4.6 |
| Mechanicville: | 9.4 |
 29.4% incidents where reported in the morning and 70.6% in the evening. The most fires (16.0%) took place on Saturday, and the least (13.1%) on Thursday.
 According to the 1,085 fires from years 2002 - 2018 most fires (10.2%) took place during July, and the least (6.6%) in February.
 Out of all 17,969 cases reported during the years 2002 - 2018, the most belonged to the categories: Rescue & EMS (60.9%), False Alarm (10.7%), and Hazardous Condition (8.0%).
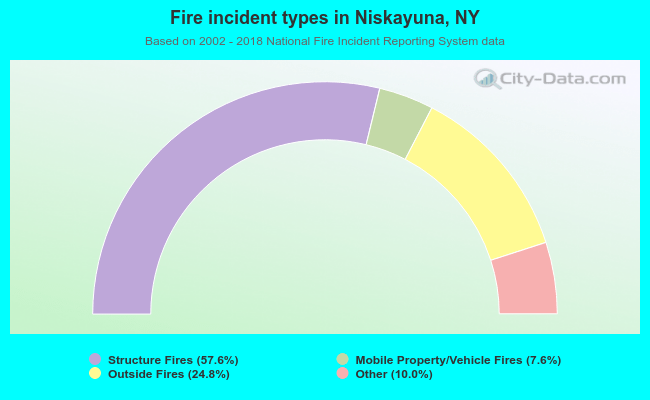 When looking into fire subcategories, the most incidents belonged to: Structure Fires (57.6%), and Outside Fires (24.8%).