| Fire incidents reported |
|---|
| Sreet name | Count |
|---|
| MAIN ST | 18 | | NEWPORT RD | 12 | | BRIDGE ST | 8 | | MAIN ST | 8 | | OLD STATE RD | 8 | | BUTLER RD | 6 | | CASTLE RD | 6 | | GAGE RD | 6 | | HONEY HILL RD | 6 | | NEWPORT GRAY RD | 6 | | WHITE CREEK RD | 6 | | BRAYTON RD | 4 | | HONEY HILL RD | 4 | | MECHANIC STREET | 4 | | NEWPORT RD | 4 | | STATE ROUTE 28 | 4 | | WHITE CREEK RD | 4 | | 103 SUMMIT RD | 2 | | 1067 HARD SCRABBLE RD | 2 | | 1232 DAIRY HILL RD | 2 | | 1248 HARD SCRABBLE RD | 2 | | 1287 HARD SCRABBLE RD | 2 | | 1326 NEWPORT GRAY RD | 2 | | 1329 NEWPORT GREY RD | 2 | | 141 STORMY HILL RD | 2 |
| | | Fire incidents reported |
|---|
| Sreet name | Count |
|---|
| 151 OLD STATE ROAD | 2 | | 157 SANDY LANE RD | 2 | | 161 BUTLER RD | 2 | | 1669 STHY8 | 2 | | 1897 NEWPORT RD | 2 | | 1957 HARD SCRABBLE RD | 2 | | 2009 CASTLE RD | 2 | | 204 ROSE VALLEY RD | 2 | | 206 GRANT RD | 2 | | 2102 STHY 5 | 2 | | 212 GRAVES RD | 2 | | 233 WHITE CREEK RD | 2 | | 277 STEUBEN RD | 2 | | 309 SNYDER RD | 2 | | 3128 MECHANIC ST | 2 | | 364 FARRELL RD | 2 | | 369 NEWPORT GRAY RD | 2 | | 392 HONEY HILL RD | 2 | | 416 BUTLER RD | 2 | | 424 ROSE VALLEY RD | 2 | | 472 SUMMITRD | 2 | | 479 LINDSAY RD | 2 | | 546 BUTLER RD | 2 | | 549 FARRELL RD. | 2 | | 569 SUMMIT RD | 2 |
|
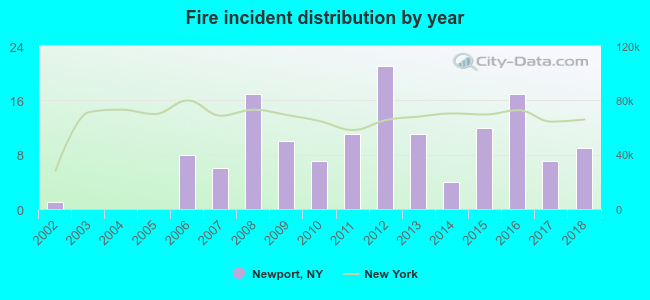 According to the data from the years 2002 - 2018 the average number of fire incidents per year is 8. The highest number of fire incidents - 21 took place in 2012, and the least - 0 in 2003. The data has a growing trend.
 39.0% incidents where reported in the morning and 61.0% in the evening. The most fires (17.7%) took place on Monday, and the least (7.1%) on Saturday.
 Based on the 141 fire incidents from years 2002 - 2018 most fires (20.6%) took place during April, and the least (2.1%) in October.
 Out of all 745 cases reported during the years 2002 - 2018, the most belonged to the categories: Rescue & EMS (54.1%), Fire (18.9%), and Hazardous Condition (11.9%).
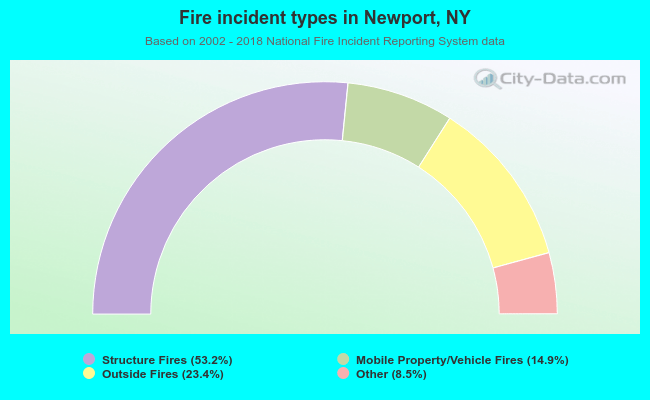 When looking into fire subcategories, the most reports belonged to: Structure Fires (53.2%), and Outside Fires (23.4%).