| Fire incidents reported |
|---|
| Sreet name | Count |
|---|
| ROUTE 11A | 60 | | ROSWELL AVE | 52 | | ROUTE 80 | 52 | | SALINA ST | 36 | | MEREDITH AVE | 24 | | LIONS DEN RD | 22 | | ROUTE 11A RD | 22 | | GIBSON RD | 20 | | INTERSTATE 81 | 20 | | KENNEDY RD | 18 | | LEONARD AVE | 18 | | FRONTAGE RD | 16 | | ROUTE 11 | 16 | | SMITH AVE | 16 | | ROCKWELL RD | 14 | | WORDEN AVE | 14 | | HEMLOCK RD | 12 | | MARTINS LN | 12 | | QUARRY RD | 12 | | RUHAMAH AVE | 12 | | THOMPSON RD | 12 | | CEDRIC AVE | 10 | | DUTTON AVE | 10 | | I 81 | 10 | | WEBSTER RD | 10 |
| | | Fire incidents reported |
|---|
| Sreet name | Count |
|---|
| WENDELL AVE | 10 | | CEDARVALE RD | 8 | | CONKLIN AVE | 8 | | ELTON AVE | 8 | | HITCHINGS RD | 8 | | OLD KENNEDY RD | 8 | | ORCHARD AVE | 8 | | PEMBROOK DR | 8 | | ROUTE 80 RD | 8 | | ROUTE 81 | 8 | | BUSSEY RD | 6 | | EVERINGHAM RD | 6 | | MEREDITH AVE | 6 | | COMMISSARY RD | 4 | | EVERINGHAM RD | 4 | | GIBSON AND ROUTE 11A RD | 4 | | HEMLOCK AND ROUTE 11 RD | 4 | | HOOVER DR | 4 | | INEZ AVE | 4 | | LAURSEN DR | 4 | | MARTINS ROUTE 11A LN | 4 | | RED MILL RD | 4 | | ROUTE 11A AND GIBSON RD | 4 | | ROUTE 11A AND NATION DAM RD | 4 | | ROUTE 20 | 4 |
|
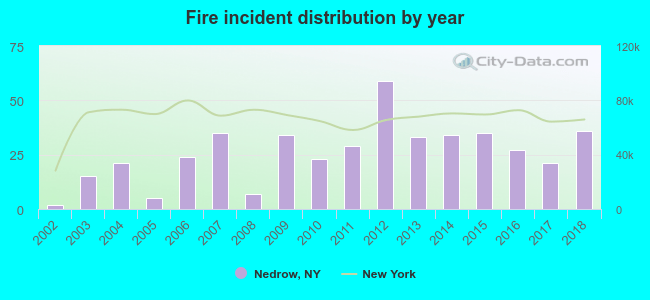 According to the data from the years 2002 - 2018 the average number of fire incidents per year is 26. The highest number of reported fires - 59 took place in 2012, and the least - 2 in 2002. The data has an increasing trend.
 42.0% incidents where reported in the morning and 58.0% in the evening. The most fires (18.6%) took place on Thursday, and the least (10.0%) on Wednesday.
 According to the 440 fire incident reports from years 2002 - 2018 most fires (13.2%) took place during April, and the least (3.6%) in December.
 Out of all 2,671 cases reported during the years 2002 - 2018, the most belonged to the categories: Rescue & EMS (52.9%), Fire (16.5%), and Good Intent Call (15.4%).
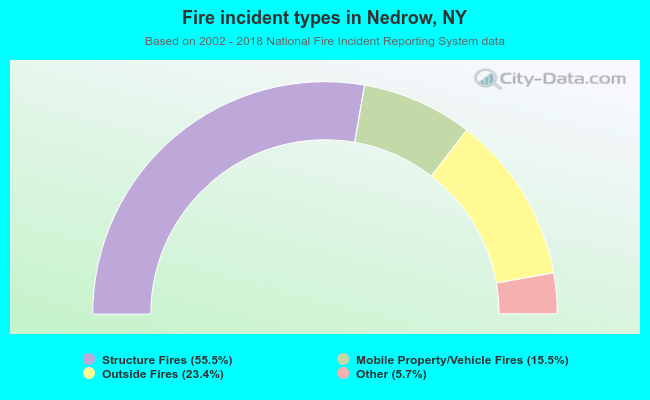 When looking into fire subcategories, the most incidents belonged to: Structure Fires (55.5%), and Outside Fires (23.4%).