| Fire incidents reported |
|---|
| Sreet name | Count |
|---|
| ROUTE 22B | 46 | | MASON ST | 44 | | SAND RD | 30 | | SOPER ST | 24 | | STATE ROUTE 22B | 24 | | KENT FALLS RD | 22 | | FLAT ROCK RD | 16 | | MILITARY TURNPIKE RT 190 | 16 | | RAND HILL RD | 16 | | BROWN RD | 12 | | SHINGLE ST | 12 | | ROUTE 3 | 10 | | RT 22B | 10 | | TURNER RD | 10 | | RAND HILL ROAD | 8 | | RIVER ST | 8 | | SAND RD | 8 | | STALEY RD | 8 | | BANKER RD | 6 | | LADUE ST | 6 | | PINE BROOK DR | 6 | | TRIM ROAD | 6 | | WOODLAND HILL RD | 6 | | AUSTIN RD | 4 | | BAKER RD | 4 |
| | | Fire incidents reported |
|---|
| Sreet name | Count |
|---|
| BEACON HILL RD | 4 | | BRADFORD RD | 4 | | CAMPSITE RD | 4 | | CHURCH ST | 4 | | FAIR GROUNDS RD | 4 | | GENERAL LEROY MANOR ROAD | 4 | | JOYCE AVE | 4 | | KIMBERLY LN | 4 | | LAPIERRE LN | 4 | | LEANDER LN | 4 | | MUTUAL AID MORRISONVILLE | 4 | | PERYEA DR | 4 | | PITCHER WAY | 4 | | ROUTE 374 | 4 | | TRACK WAY CC FAIR GROUND WAY | 4 | | 22B | 2 | | ABLE WAY | 2 | | ARROW HEAD WAY | 2 | | BAKER RD. | 2 | | BARCOMB AVE | 2 | | BEECHWOOD DR | 2 | | BROADWELL RD | 2 | | BULLIS RD | 2 | | CATHERINE HAYS LN | 2 | | |
|
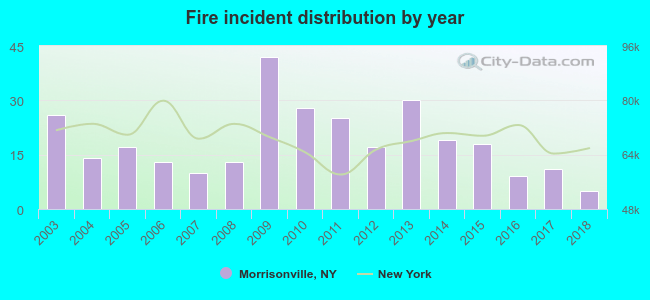 Based on the data from the years 2003 - 2018 the average number of fire incidents per year is 19. The highest number of reported fires - 42 took place in 2009, and the least - 5 in 2018. The data has a declining trend.
 27.3% incidents where reported in the morning and 72.7% in the evening. The most fires (17.5%) took place on Wednesday, and the least (12.1%) on Thursday.
 Based on the 297 fire incidents from years 2003 - 2018 most fires (20.5%) took place during May, and the least (4.4%) in August.
 Out of all 1,160 cases reported during the years 2003 - 2018, the most belonged to the categories: Rescue & EMS (31.6%), Fire (25.6%), and Service Call (15.9%).
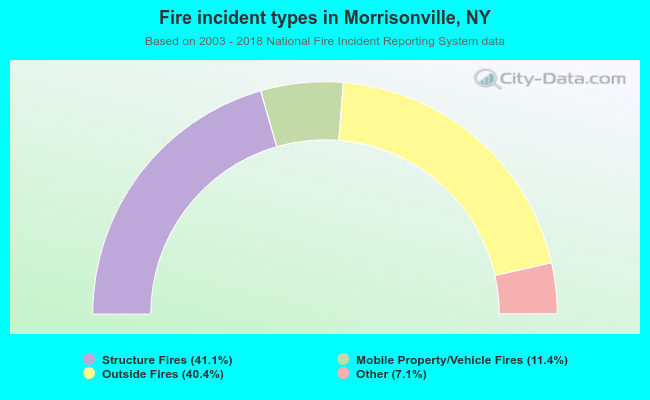 When looking into fire subcategories, the most incidents belonged to: Structure Fires (41.1%), and Outside Fires (40.4%).