Mooresville: Fire Incidents, Indiana (IN)
Where are fire incidents reported in Mooresville, IN
Something went wrong! Please refresh the page.
| Fire incidents reported | |
|---|---|
| Sreet name | Count |
| INDIANA ST | 140 |
| SOUTH ST | 82 |
| CENTENARY RD | 72 |
| HIGH ST | 70 |
| BRIDGE ST | 68 |
| MAIN ST | 66 |
| HADLEY RD | 50 |
| INDIANAPOLIS RD | 50 |
| WASHINGTON ST | 48 |
| KITCHEN RD | 44 |
| HARRISON ST | 40 |
| S.R. 67 | 36 |
| ROOKER RD | 34 |
| CONDUITT DR | 32 |
| GASBURG RD | 32 |
| BUNKER HILL RD | 30 |
| EDGEWOOD DR | 28 |
| LANDERSDALE RD | 28 |
| MANN RD | 26 |
| CROSBY RD | 24 |
| LEWIS DR | 24 |
| S.R. 144 | 24 |
| SR 144 | 24 |
| CARLISLE ST | 22 |
| JOHNSON RD | 22 |
| MEMORIAL DR | 22 |
| PLEIADES DR | 22 |
| ST RD 144 | 22 |
| CHISHOLM TRL | 20 |
| CHURCHILL DR | 20 |
| Other | 662 |
2002 - 2018 National Fire Incident Reporting System (NFIRS) incidents
- Incident types reported to NFIRS in Mooresville, IN
- 8,98764.0%Rescue & EMS
- 1,88413.4%Fire
- 1,3119.3%Good Intent Call
- 8496.0%Hazardous Condition
- 5614.0%Service Call
- 3912.8%False Alarm
- 260.2%Special Incident
- Fire incident types reported to NFIRS in Mooresville, IN
- 92349.0%Structure Fires
- 62733.3%Outside Fires
- 24813.2%Mobile Property/Vehicle Fires
- 864.6%Other
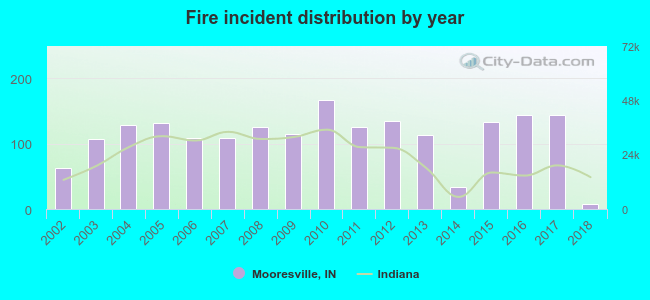 According to the data from the years 2002 - 2018 the average number of fire incidents per year is 111. The highest number of fire incidents - 166 took place in 2010, and the least - 8 in 2018. The data has a declining trend.
The average number of yearly fire incidents per 10k residents in Mooresville, IN compared to nearest cities:
(Note: Based on data for the last 3 years, including only cities with population 5,000 and above)
| Mooresville: | 102.3 |
| Plainfield: | 9.8 |
| Avon: | 44.2 |
| Bargersville: | 39.2 |
| Martinsville: | 76.9 |
| Danville: | 44.1 |
| Greenwood: | 12.8 |
| Speedway: | 40.2 |
| New Whiteland: | 22.9 |
 The median response time based on all reported fire incidents is 6 minutes. This is close to the state median value.
The median response time in Mooresville, IN compared to nearest cities:
(Note: Based on data for all years, including only cities with at least 500 fire incidents)
| Mooresville: | 6 minutes |
| Plainfield: | 6 minutes |
| Clayton: | 10 minutes |
| Avon: | 7 minutes |
| Bargersville: | 7 minutes |
| Martinsville: | 8 minutes |
| Danville: | 8 minutes |
| Greenwood: | 6 minutes |
| Brownsburg: | 6 minutes |
 Based on the reports from the years 2002 - 2018 the average number of fire-related casualties per year is 1. The highest number of reported casualties - 5 took place in 2013, and the lowest - 0 in 2002. The data has a constant trend.
The average number of casualties per 1,000 fire incidents is 11. This indicator was the highest - 44 in 2013, and the lowest 0 in 2002. The trend for casualties per 1,000 fire incidents is constant. Compared to the Indiana value the number of injuries per 1,000 fires is higher.
Based on the reports from the years 2002 - 2018 the average number of fire-related casualties per year is 1. The highest number of reported casualties - 5 took place in 2013, and the lowest - 0 in 2002. The data has a constant trend.
The average number of casualties per 1,000 fire incidents is 11. This indicator was the highest - 44 in 2013, and the lowest 0 in 2002. The trend for casualties per 1,000 fire incidents is constant. Compared to the Indiana value the number of injuries per 1,000 fires is higher.Casualties per 1,000 incidents in Mooresville, IN compared to nearest cities:
(Note: Based on data for all years, including only cities with at least 500 fire incidents)
| Mooresville: | 11.7 |
| Plainfield: | 33.4 |
| Clayton: | 2.4 |
| Avon: | 2.4 |
| Bargersville: | 7.1 |
| Martinsville: | 10.7 |
| Danville: | 0.9 |
| Greenwood: | 5.9 |
| Brownsburg: | 22.5 |
 33.0% incidents where reported in the morning and 67.0% in the evening. The most fires (17.1%) took place on Saturday, and the least (11.3%) on Tuesday.
 According to the 1,884 reports from years 2002 - 2018 most fires (9.7%) took place during July, and the least (6.4%) in September.
 Out of all 14,034 cases reported during the years 2002 - 2018, the most belonged to the categories: Rescue & EMS (64.0%), Fire (13.4%), and Good Intent Call (9.3%).
 When looking into fire subcategories, the most reports belonged to: Structure Fires (49.0%), and Outside Fires (33.3%).