| Fire incidents reported |
|---|
| Sreet name | Count |
|---|
| OLD MONTAUK HWY | 38 | | MONTAUK HWY | 28 | | STAR ISLAND DR | 16 | | DEFOREST RD | 14 | | LAKE DR | 14 | | EDGEMERE ST | 10 | | EMERSON AVE | 8 | | FAIRLAWN DR | 8 | | FLAMINGO AVE | 8 | | GLENMORE AVE | 8 | | SOUNDVIEW DR | 8 | | WEST LAKE DR | 8 | | BEACHPLUM RD | 6 | | DITCH PLAINS RD | 6 | | ETNA AVE | 6 | | GAINESBORO CT | 6 | | OLD WEST LAKE DR | 6 | | ATLANTIC OCEAN | 4 | | BAYBERRY RD | 4 | | BEACHPLUM RD | 4 | | CAMP HERO RD | 4 | | DEER WAY | 4 | | DURYEA AVE | 4 | | ELMWOOD AVE | 4 | | ELROY DR | 4 |
| | | Fire incidents reported |
|---|
| Sreet name | Count |
|---|
| ELWELL ST | 4 | | FAIRVIEW AV | 4 | | FAIRVIEW AVE | 4 | | FARRAGUT RD | 4 | | FERNCROFT PL | 4 | | FLAMINGO RD | 4 | | GULL RD | 4 | | KETTLE HOLE RD | 4 | | MONTAUK AND LINCOLN RD | 4 | | MONTAUK AND WEBSTER RD | 4 | | NECK LN | 4 | | OLD WESTLAKE DR | 4 | | SEASIDE AVE | 4 | | SECOND HOUSE RD | 4 | | STAR ISLAND RD | 4 | | SURFSIDE AVE | 4 | | THE PLAZA | 4 | | TUTHILL RD | 4 | | AGNEW AVE | 2 | | BRISBANE RD | 2 | | CAMO HERO RD | 2 | | CAPTAIN KIDD PATH | 2 | | CAPTAIN KIDDS PATH | 2 | | CASWELL RD | 2 | | DAVIS DR | 2 |
|
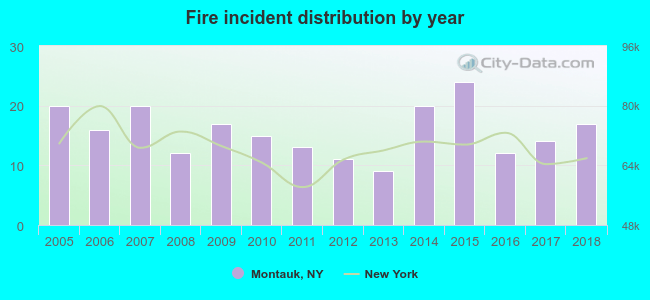 According to the data from the years 2005 - 2018 the average number of fires per year is 16. The highest number of reported fires - 24 took place in 2015, and the least - 9 in 2013. The data has a dropping trend.
 31.8% incidents where reported in the morning and 68.2% in the evening. The most fires (19.5%) took place on Saturday, and the least (10.5%) on Thursday.
 According to the 220 fire incidents from years 2005 - 2018 most fires (14.1%) took place during July, and the least (5.0%) in February.
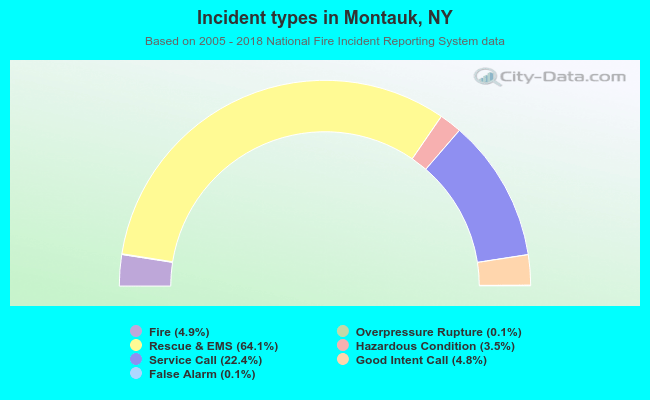 Out of all 4,459 cases reported during the years 2005 - 2018, the most belonged to the categories: Rescue & EMS (64.1%), Service Call (22.4%), and Fire (4.9%).
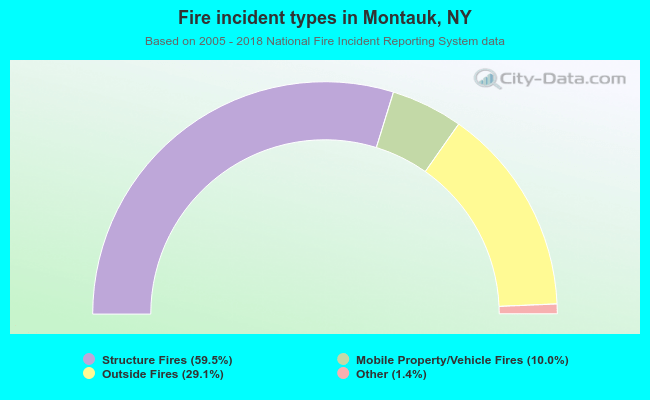 When looking into fire subcategories, the most incidents belonged to: Structure Fires (59.5%), and Outside Fires (29.1%).