Lindsay: Fire Incidents, California (CA)
Where are fire incidents reported in Lindsay, CA
Something went wrong! Please refresh the page.
|
| |||||||||||||||||||||||||||||||||||||||||||||||||||||||||||||||||||||||||||||||||||||||||||||||||||||||||||||
| Other | 67 | |||||||||||||||||||||||||||||||||||||||||||||||||||||||||||||||||||||||||||||||||||||||||||||||||||||||||||||
2005 - 2018 National Fire Incident Reporting System (NFIRS) incidents
- Incident types reported to NFIRS in Lindsay, CA
- 68441.5%Rescue & EMS
- 55333.6%Fire
- 18111.0%Good Intent Call
- 975.9%Hazardous Condition
- 915.5%Service Call
- 311.9%False Alarm
- 90.5%Special Incident
- Fire incident types reported to NFIRS in Lindsay, CA
- 29353.0%Outside Fires
- 12121.9%Mobile Property/Vehicle Fires
- 11120.1%Structure Fires
- 285.1%Other
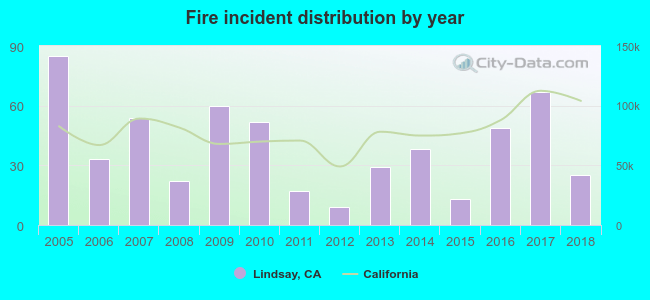 Based on the data from the years 2005 - 2018 the average number of fire incidents per year is 40. The highest number of fire incidents - 85 took place in 2005, and the least - 9 in 2012. The data has a declining trend.
The average number of yearly fire incidents per 10k residents in Lindsay, CA compared to nearest cities:
(Note: Based on data for the last 3 years, including only cities with population 5,000 and above)
| Lindsay: | 35.6 |
| Exeter: | 87.5 |
| Farmersville: | 36.5 |
| Porterville: | 54.1 |
| Tulare: | 50.4 |
| Woodlake: | 77.9 |
| Visalia: | 41.3 |
| Earlimart: | 91.4 |
| Cutler: | 47.3 |
 The median response time based on all reported fire incidents is 8 minutes. This is higher compared to the state median value.
The median response time in Lindsay, CA compared to nearest cities:
(Note: Based on data for all years, including only cities with at least 500 fire incidents)
| Lindsay: | 8 minutes |
| Exeter: | 7 minutes |
| Farmersville: | 5 minutes |
| Porterville: | 5 minutes |
| Tulare: | 5 minutes |
| Woodlake: | 7 minutes |
| Visalia: | 6 minutes |
| Earlimart: | 8 minutes |
| Corcoran: | 6 minutes |
 29.3% incidents where reported in the morning and 70.7% in the evening. The most fires (16.1%) took place on Saturday, and the least (12.1%) on Wednesday.
 Based on the 553 reports from years 2005 - 2018 most fires (12.7%) took place during May, and the least (4.3%) in September.
 Out of all 1,648 cases reported during the years 2005 - 2018, the most belonged to the categories: Rescue & EMS (41.5%), Fire (33.6%), and Good Intent Call (11.0%).
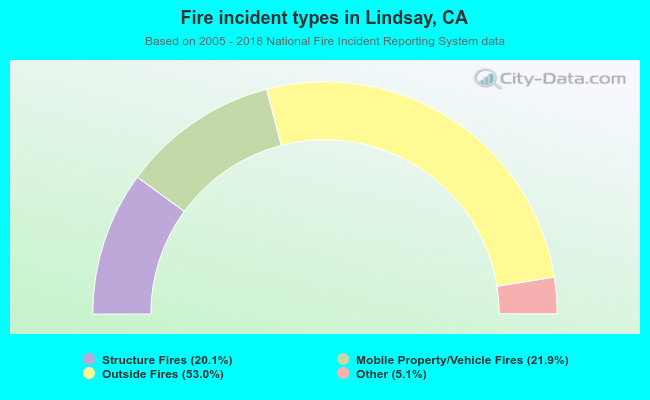 When looking into fire subcategories, the most incidents belonged to: Outside Fires (53.0%), and Mobile Property/Vehicle Fires (21.9%).