Lake George: Fire Incidents, New York (NY)
Where are fire incidents reported in Lake George, NY
Something went wrong! Please refresh the page.
|
| |||||||||||||||||||||||||||||||||||||||||||||||||||||||||||||||||||||||||||||||||||||||||||||||||||||||||||||
2002 - 2018 National Fire Incident Reporting System (NFIRS) incidents
- Incident types reported to NFIRS in Lake George, NY
- 1,41740.9%Rescue & EMS
- 64018.5%Fire
- 56816.4%Hazardous Condition
- 47013.6%False Alarm
- 1905.5%Good Intent Call
- 1624.7%Service Call
- 100.3%Overpressure Rupture
- 50.1%Severe Weather
- Fire incident types reported to NFIRS in Lake George, NY
- 33752.7%Structure Fires
- 17627.5%Outside Fires
- 10215.9%Mobile Property/Vehicle Fires
- 253.9%Other
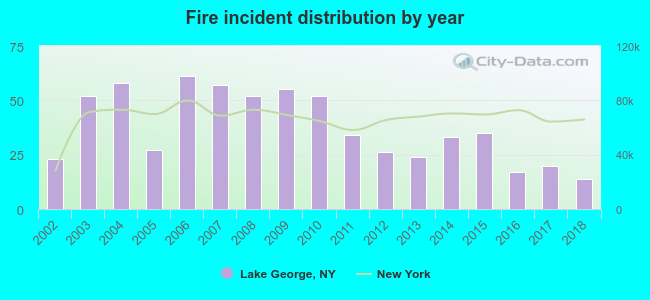 Based on the data from the years 2002 - 2018 the average number of fires per year is 38. The highest number of fire incidents - 61 took place in 2006, and the least - 14 in 2018. The data has a decreasing trend.
 The median response time based on all reported fire incidents is 7 minutes. This is higher than the state median value.
The median response time in Lake George, NY compared to nearest cities:
(Note: Based on data for all years, including only cities with at least 500 fire incidents)
| Lake George: | 7 minutes |
| Queensbury: | 5 minutes |
| Glens Falls: | 3 minutes |
| Hudson Falls: | 7 minutes |
| Saratoga Springs: | 5 minutes |
 38.3% incidents where reported in the morning and 61.7% in the evening. The most fires (15.9%) took place on Saturday, and the least (10.8%) on Wednesday.
 According to the 640 fire incidents from years 2002 - 2018 most fires (15.3%) took place during July, and the least (4.5%) in February.
 Out of all 3,463 cases reported during the years 2002 - 2018, the most belonged to the categories: Rescue & EMS (40.9%), Fire (18.5%), and Hazardous Condition (16.4%).
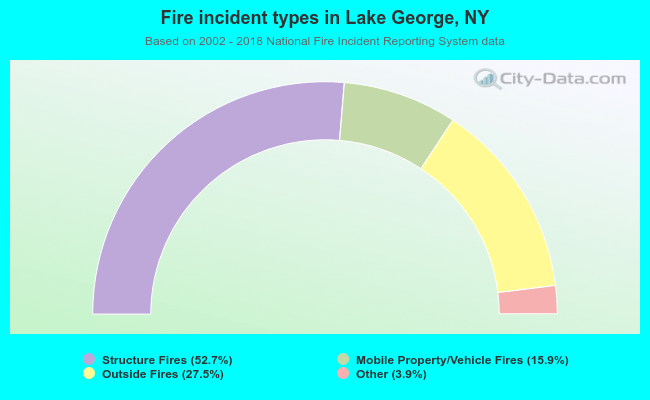 When looking into fire subcategories, the most incidents belonged to: Structure Fires (52.7%), and Outside Fires (27.5%).