Hicksville: Fire Incidents, New York (NY)
Where are fire incidents reported in Hicksville, NY
Something went wrong! Please refresh the page.
| Fire incidents reported | |
|---|---|
| Sreet name | Count |
| NEWBRIDGE RD | 160 |
| N BROADWAY | 82 |
| W JOHN ST | 78 |
| W OLD COUNTRY RD | 74 |
| BROADWAY MALL | 72 |
| DUFFY AVE | 56 |
| BROADWAY | 52 |
| S BROADWAY | 48 |
| JERUSALEM AVE | 44 |
| S OYSTER BAY RD | 40 |
| BETHPAGE RD | 26 |
| E OLD COUNTRY RD | 26 |
| WOODBURY RD | 26 |
| CHARLOTTE AVE | 22 |
| LEVITTOWN PKY | 22 |
| BURNS AVE | 20 |
| ACRE LN | 18 |
| BALLPARK LN | 18 |
| DIVISION AVE | 18 |
| E MARIE ST | 16 |
| LANTERN RD | 16 |
| STEWART AVE | 16 |
| W NICHOLAI ST | 16 |
| W VILLAGE GRN | 16 |
| PLAINVIEW RD | 14 |
| RICHARD AVE | 14 |
| WEST AVE | 14 |
| BRITTLE LN | 12 |
| ELM ST | 12 |
| FORK LN | 12 |
2004 - 2018 National Fire Incident Reporting System (NFIRS) incidents
- Incident types reported to NFIRS in Hicksville, NY
- 4,60049.8%Rescue & EMS
- 1,43215.5%Hazardous Condition
- 1,01010.9%False Alarm
- 1,00210.8%Fire
- 6977.5%Good Intent Call
- 5015.4%Service Call
- Fire incident types reported to NFIRS in Hicksville, NY
- 43643.5%Outside Fires
- 28728.6%Structure Fires
- 18018.0%Mobile Property/Vehicle Fires
- 999.9%Other
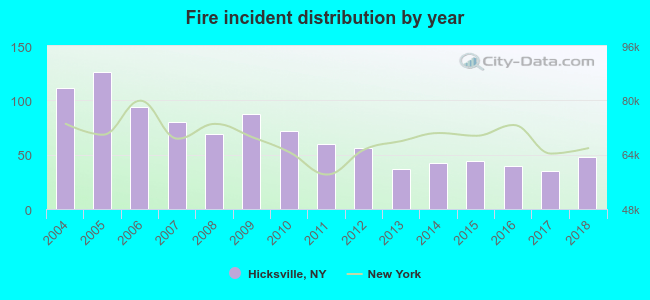 According to the data from the years 2004 - 2018 the average number of fire incidents per year is 67. The highest number of fires - 126 took place in 2005, and the least - 35 in 2017. The data has a decreasing trend.
The average number of yearly fire incidents per 10k residents in Hicksville, NY compared to nearest cities:
(Note: Based on data for the last 3 years, including only cities with population 5,000 and above)
| Hicksville: | 9.9 |
| Jericho: | 14.0 |
| Salisbury: | 5.0 |
| New Cassel: | 0.7 |
| Bethpage: | 13.2 |
| Plainview: | 9.3 |
| Levittown: | 5.2 |
| Westbury: | 9.4 |
| Old Bethpage: | 3.0 |
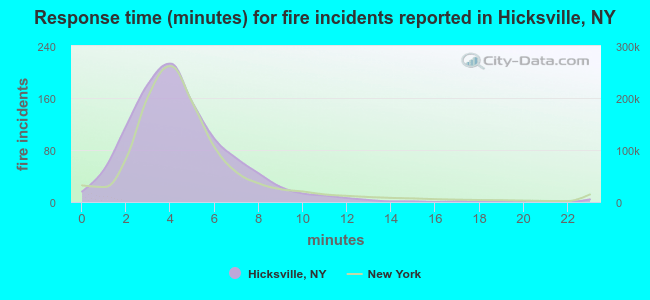 The median response time based on all reported fire incidents is 4 minutes. This is close to the state median value.
The median response time in Hicksville, NY compared to nearest cities:
(Note: Based on data for all years, including only cities with at least 500 fire incidents)
| Hicksville: | 4 minutes |
| Levittown: | 3 minutes |
| Hempstead: | 3 minutes |
| Massapequa: | 6 minutes |
| Garden City: | 3 minutes |
| Wyandanch: | 3 minutes |
| West Hempstead: | 0 minutes |
| Huntington Station: | 4 minutes |
| Freeport: | 3 minutes |
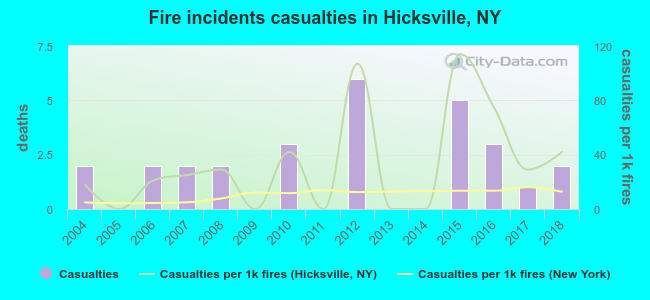 According to the reports from the years 2004 - 2018 the average number of fire-related yearly casualties is 2. The highest number of reported casualties - 6 took place in 2012, and the lowest - 0 in 2005. The data has a constant trend.
The average number of casualties per 1,000 fire incidents is 33. This indicator was the highest - 114 in 2015, and the lowest 0 in 2005. The trend for casualties per 1,000 fire incidents is rising. Compared to the state value the number of casualties per 1,000 fires is much higher.
According to the reports from the years 2004 - 2018 the average number of fire-related yearly casualties is 2. The highest number of reported casualties - 6 took place in 2012, and the lowest - 0 in 2005. The data has a constant trend.
The average number of casualties per 1,000 fire incidents is 33. This indicator was the highest - 114 in 2015, and the lowest 0 in 2005. The trend for casualties per 1,000 fire incidents is rising. Compared to the state value the number of casualties per 1,000 fires is much higher.Casualties per 1,000 incidents in Hicksville, NY compared to nearest cities:
(Note: Based on data for all years, including only cities with at least 500 fire incidents)
| Hicksville: | 27.9 |
| Levittown: | 14.6 |
| Hempstead: | 21.2 |
| Massapequa: | 3.8 |
| Garden City: | 11.3 |
| Wyandanch: | 6.8 |
| West Hempstead: | 0.0 |
| Huntington Station: | 0.0 |
| Freeport: | 46.4 |
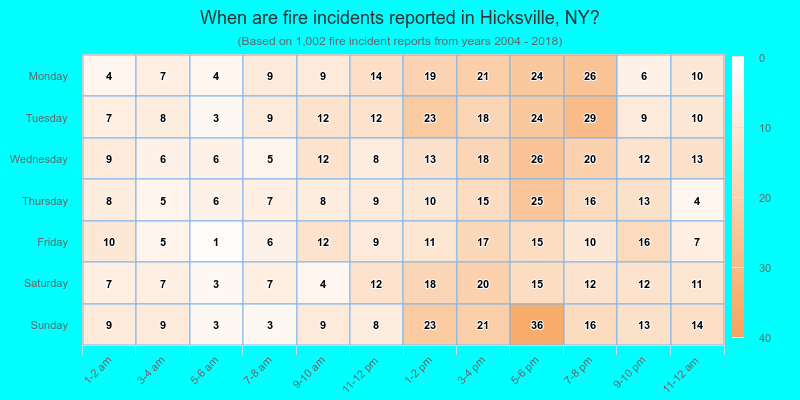
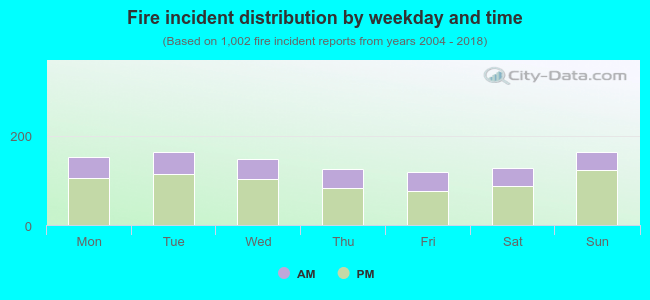 31.0% incidents where reported in the morning and 69.0% in the evening. The most fires (16.4%) took place on Tuesday, and the least (11.9%) on Friday.
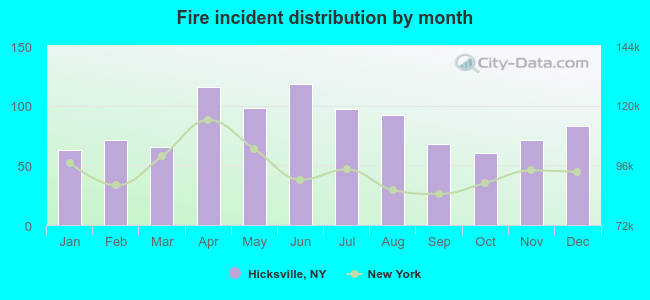 According to the 1,002 fire incidents from years 2004 - 2018 most fires (11.8%) took place during June, and the least (6.0%) in October.
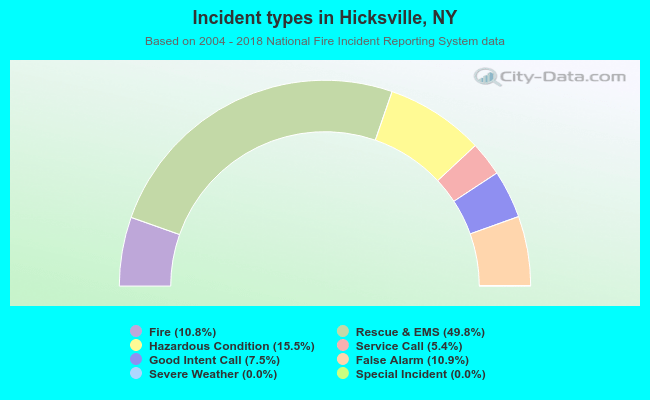 Out of all 9,245 cases reported during the years 2004 - 2018, the most belonged to the categories: Overpressure Rupture (49.8%), Rescue & EMS (15.5%), and Good Intent Call (10.9%).
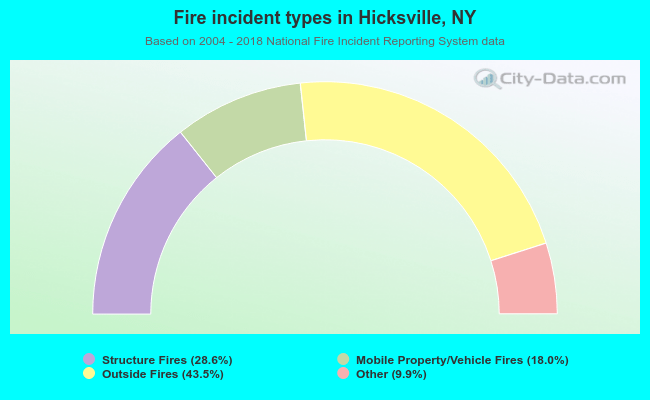 When looking into fire subcategories, the most reports belonged to: Outside Fires (43.5%), and Structure Fires (28.6%).