Goshen: Fire Incidents, New York (NY)
Where are fire incidents reported in Goshen, NY
Something went wrong! Please refresh the page.
|
| |||||||||||||||||||||||||||||||||||||||||||||||||||||||||||||||||||||||||||||||||||||||||||||||||||||||||||||
2002 - 2018 National Fire Incident Reporting System (NFIRS) incidents
- Incident types reported to NFIRS in Goshen, NY
- 2,42341.2%Hazardous Condition
- 1,02917.5%False Alarm
- 75512.8%Fire
- 65411.1%Rescue & EMS
- 5829.9%Service Call
- 4066.9%Good Intent Call
- 130.2%Special Incident
- 120.2%Overpressure Rupture
- 60.1%Severe Weather
- Fire incident types reported to NFIRS in Goshen, NY
- 39852.7%Structure Fires
- 19125.3%Outside Fires
- 8711.5%Other
- 7910.5%Mobile Property/Vehicle Fires
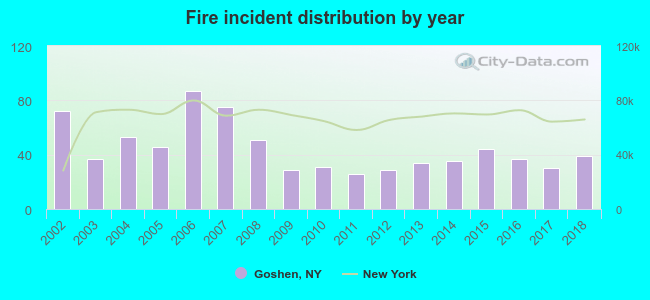 According to the data from the years 2002 - 2018 the average number of fires per year is 44. The highest number of fires - 87 took place in 2006, and the least - 26 in 2011. The data has a dropping trend.
The average number of yearly fire incidents per 10k residents in Goshen, NY compared to nearest cities:
(Note: Based on data for the last 3 years, including only cities with population 5,000 and above)
| Goshen: | 65.6 |
| Middletown: | 60.0 |
| Blooming Grove: | 4.8 |
| Monroe: | 267.1 |
| Washingtonville: | 29.9 |
| Kiryas Joel: | 1.2 |
| Warwick: | 83.0 |
| Mount Hope: | 12.8 |
| Walden: | 23.8 |
 The median response time based on all reported fire incidents is 4 minutes. This is comparable to the New York median value.
The median response time in Goshen, NY compared to nearest cities:
(Note: Based on data for all years, including only cities with at least 500 fire incidents)
| Goshen: | 4 minutes |
| Chester: | 6 minutes |
| Middletown: | 3 minutes |
| Monroe: | 2 minutes |
| Montgomery: | 6 minutes |
| Warwick: | 4 minutes |
| Walden: | 5 minutes |
| Pine Bush: | 6 minutes |
| New Windsor: | 7 minutes |
 29.5% incidents where reported in the morning and 70.5% in the evening. The most fires (16.8%) took place on Friday, and the least (11.8%) on Thursday.
 According to the 755 reports from years 2002 - 2018 most fires (10.6%) took place during April, and the least (6.2%) in October.
 Out of all 5,880 cases reported during the years 2002 - 2018, the most belonged to the categories: Hazardous Condition (41.2%), False Alarm (17.5%), and Fire (12.8%).
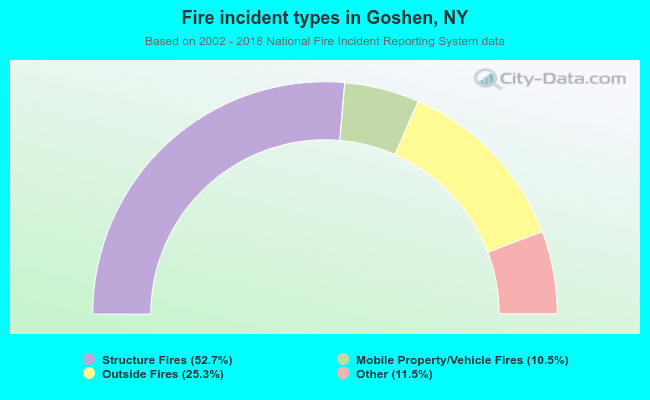 When looking into fire subcategories, the most reports belonged to: Structure Fires (52.7%), and Outside Fires (25.3%).