Downey: Fire Incidents, California (CA)
Where are fire incidents reported in Downey, CA
Something went wrong! Please refresh the page.
| Fire incidents reported | |
|---|---|
| Sreet name | Count |
| FIRESTONE BLVD | 282 |
| LAKEWOOD BLVD | 170 |
| IMPERIAL HWY | 168 |
| PARAMOUNT BLVD | 162 |
| 5 SANTA ANA FRWY | 76 |
| STEWART AND GRAY RD | 74 |
| BELLFLOWER BLVD | 64 |
| FLORENCE AV | 62 |
| 5 SANTA ANA | 56 |
| DOWNEY AV | 54 |
| TELEGRAPH RD | 54 |
| 5 - SANTA ANA FRWY | 50 |
| FLORENCE | 42 |
| OLD RIVER SCHOOL RD | 42 |
| 105 GLENN ANDERSON | 38 |
| SUVA ST | 38 |
| 605 SAN GABRIEL RIVER | 36 |
| 605 SAN GABRIEL RIVER FRWY | 36 |
| 105 - GLENN ANDERSON FRWY | 34 |
| BROOKSHIRE AV | 34 |
| 105 GLENN ANDERSON FRWY | 32 |
| DOWNEY | 30 |
| WASHBURN RD | 28 |
| WOODRUFF AV | 26 |
| DINWIDDIE ST | 22 |
| ELM VISTA DR | 22 |
| HALL RD | 22 |
| PICO VISTA RD | 22 |
| RIVES | 22 |
| 3RD ST | 20 |
2005 - 2018 National Fire Incident Reporting System (NFIRS) incidents
- Incident types reported to NFIRS in Downey, CA
- 21,14565.6%Rescue & EMS
- 5,12315.9%Good Intent Call
- 1,6825.2%Fire
- 1,4444.5%Service Call
- 1,4254.4%False Alarm
- 1,2884.0%Hazardous Condition
- 860.3%Special Incident
- Fire incident types reported to NFIRS in Downey, CA
- 87752.1%Outside Fires
- 36021.4%Mobile Property/Vehicle Fires
- 35020.8%Structure Fires
- 955.6%Other
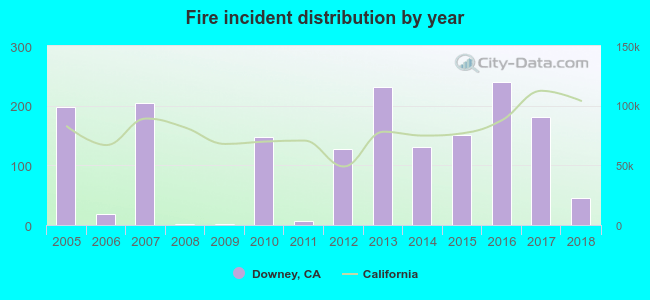 According to the data from the years 2005 - 2018 the average number of fire incidents per year is 120. The highest number of fires - 239 took place in 2016, and the least - 1 in 2008. The data has a declining trend.
The average number of yearly fire incidents per 10k residents in Downey, CA compared to nearest cities:
(Note: Based on data for the last 3 years, including only cities with population 5,000 and above)
| Downey: | 13.6 |
| Bell Gardens: | 18.3 |
| Paramount: | 19.3 |
| Bellflower: | 19.1 |
| Cudahy: | 13.6 |
| Norwalk: | 12.2 |
| Santa Fe Springs: | 47.1 |
| South Gate: | 15.8 |
| Bell: | 19.0 |
 The median response time based on all reported fire incidents is 7 minutes. This is similar to the state median value.
The median response time in Downey, CA compared to nearest cities:
(Note: Based on data for all years, including only cities with at least 500 fire incidents)
| Downey: | 7 minutes |
| Bell Gardens: | 5 minutes |
| Paramount: | 5 minutes |
| Bellflower: | 4 minutes |
| Norwalk: | 5 minutes |
| Santa Fe Springs: | 7 minutes |
| South Gate: | 5 minutes |
| Bell: | 5 minutes |
| Lynwood: | 4 minutes |
 According to the reports from the years 2005 - 2018 the average number of fire-related fatalities per year is 0. The highest number of deaths - 1 took place in 2006, and the lowest - 0 in 2005. The data has a constant trend.
 Based on the reports from the years 2005 - 2018 the average number of fire-related yearly casualties is 1. The highest number of casualties - 5 took place in 2016, and the lowest - 0 in 2006. The data has a decreasing trend.
The average number of casualties per 1,000 fires is 5. This indicator was the highest - 21 in 2016, and the lowest 0 in 2006. The trend for casualties per 1,000 fires is dropping. Compared to the California value the number of casualties per 1,000 fires is higher.
Based on the reports from the years 2005 - 2018 the average number of fire-related yearly casualties is 1. The highest number of casualties - 5 took place in 2016, and the lowest - 0 in 2006. The data has a decreasing trend.
The average number of casualties per 1,000 fires is 5. This indicator was the highest - 21 in 2016, and the lowest 0 in 2006. The trend for casualties per 1,000 fires is dropping. Compared to the California value the number of casualties per 1,000 fires is higher.Casualties per 1,000 incidents in Downey, CA compared to nearest cities:
(Note: Based on data for all years, including only cities with at least 500 fire incidents)
| Downey: | 7.7 |
| Bell Gardens: | 0.0 |
| Paramount: | 0.0 |
| Bellflower: | 0.0 |
| Norwalk: | 1.4 |
| Santa Fe Springs: | 1.2 |
| South Gate: | 0.0 |
| Bell: | 4.1 |
| Lynwood: | 0.0 |
 33.7% incidents where reported in the morning and 66.3% in the evening. The most fires (17.0%) took place on Sunday, and the least (12.2%) on Friday.
 Based on the 1,682 fire incident reports from years 2005 - 2018 most fires (10.8%) took place during January, and the least (4.6%) in September.
 Out of all 32,224 cases reported during the years 2005 - 2018, the most belonged to the categories: Rescue & EMS (65.6%), Good Intent Call (15.9%), and Fire (5.2%).
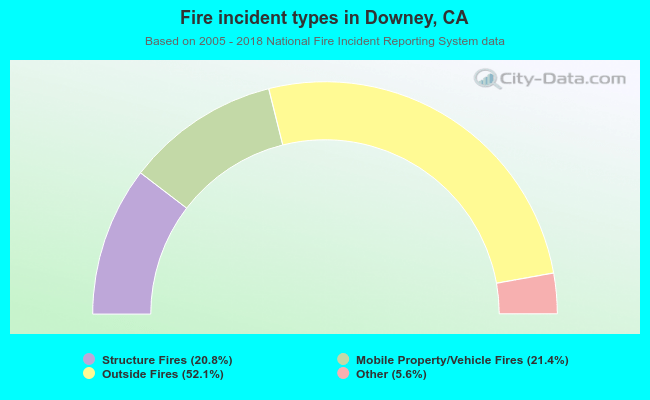 When looking into fire subcategories, the most incidents belonged to: Outside Fires (52.1%), and Mobile Property/Vehicle Fires (21.4%).