Chaska: Fire Incidents, Minnesota (MN)
Where are fire incidents reported in Chaska, MN
Something went wrong! Please refresh the page.
|
| |||||||||||||||||||||||||||||||||||||||||||||||||||||||||||||||||||||||||||||||||||||||||||||||||||||||||||||
| Other | 4 | |||||||||||||||||||||||||||||||||||||||||||||||||||||||||||||||||||||||||||||||||||||||||||||||||||||||||||||
2002 - 2018 National Fire Incident Reporting System (NFIRS) incidents
- Incident types reported to NFIRS in Chaska, MN
- 2,70850.7%Rescue & EMS
- 70413.2%Fire
- 64612.1%False Alarm
- 63811.9%Hazardous Condition
- 3416.4%Good Intent Call
- 2374.4%Service Call
- 420.8%Severe Weather
- 240.4%Overpressure Rupture
- Fire incident types reported to NFIRS in Chaska, MN
- 31344.5%Structure Fires
- 20729.4%Outside Fires
- 12818.2%Mobile Property/Vehicle Fires
- 568.0%Other
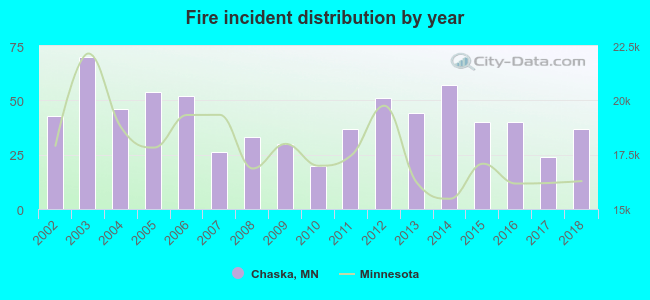 Based on the data from the years 2002 - 2018 the average number of fires per year is 41. The highest number of fire incidents - 70 took place in 2003, and the least - 20 in 2010. The data has a dropping trend.
The average number of yearly fire incidents per 10k residents in Chaska, MN compared to nearest cities:
(Note: Based on data for the last 3 years, including only cities with population 5,000 and above)
| Chaska: | 13.6 |
| Chanhassen: | 11.3 |
| Victoria: | 14.3 |
| Shakopee: | 24.1 |
| Shorewood: | 10.6 |
| Eden Prairie: | 15.2 |
| Mound: | 25.8 |
| Minnetrista: | 20.3 |
| Jordan: | 35.7 |
 The median response time based on all reported fire incidents is 4 minutes. This is lower compared to the state median value.
The median response time in Chaska, MN compared to nearest cities:
(Note: Based on data for all years, including only cities with at least 500 fire incidents)
| Chaska: | 4 minutes |
| Shakopee: | 5 minutes |
| Eden Prairie: | 6 minutes |
| Prior Lake: | 4 minutes |
| Minnetonka: | 7 minutes |
| Hopkins: | 5 minutes |
| Savage: | 5 minutes |
| Edina: | 5 minutes |
| Bloomington: | 5 minutes |
 34.4% incidents where reported in the morning and 65.6% in the evening. The most fires (16.3%) took place on Friday, and the least (12.4%) on Sunday.
 Based on the 704 fires from years 2002 - 2018 most fires (12.9%) took place during July, and the least (5.0%) in January.
 Out of all 5,344 cases reported during the years 2002 - 2018, the most belonged to the categories: Rescue & EMS (50.7%), Fire (13.2%), and False Alarm (12.1%).
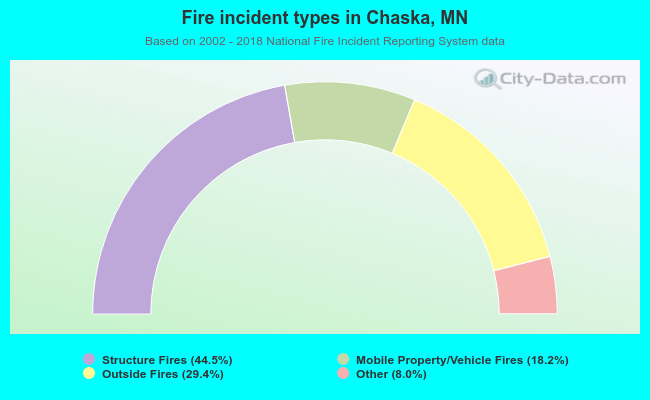 When looking into fire subcategories, the most reports belonged to: Structure Fires (44.5%), and Outside Fires (29.4%).