Charlton: Fire Incidents, New York (NY)
Where are fire incidents reported in Charlton, NY
Something went wrong! Please refresh the page.
|
| |||||||||||||||||||||||||||||||||||||||||||||||||||||||||||||||||||||||||||||||||||||||||||||||||||||||||||||
2002 - 2018 National Fire Incident Reporting System (NFIRS) incidents
- Incident types reported to NFIRS in Charlton, NY
- 56745.3%Rescue & EMS
- 22017.6%Hazardous Condition
- 15212.2%False Alarm
- 12510.0%Good Intent Call
- 1149.1%Fire
- 635.0%Service Call
- 50.4%Special Incident
- 40.3%Severe Weather
- Fire incident types reported to NFIRS in Charlton, NY
- 5144.7%Structure Fires
- 4438.6%Outside Fires
- 108.8%Other
- 97.9%Mobile Property/Vehicle Fires
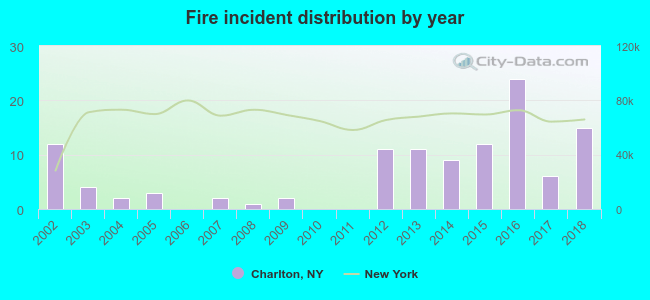 Based on the data from the years 2002 - 2018 the average number of fire incidents per year is 7. The highest number of reported fires - 24 took place in 2016, and the least - 0 in 2006. The data has a rising trend.
 24.6% incidents where reported in the morning and 75.4% in the evening. The most fires (21.9%) took place on Saturday, and the least (9.6%) on Monday.
 Based on the 114 incident reports from years 2002 - 2018 most fires (14.9%) took place during November, and the least (2.6%) in October.
 Out of all 1,251 cases reported during the years 2002 - 2018, the most belonged to the categories: Rescue & EMS (45.3%), Hazardous Condition (17.6%), and False Alarm (12.2%).
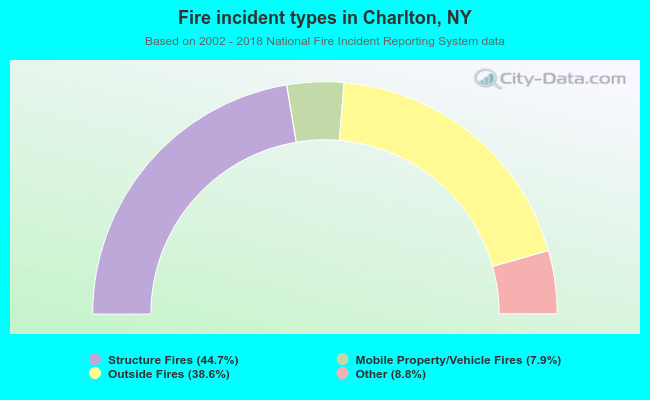 When looking into fire subcategories, the most incidents belonged to: Structure Fires (44.7%), and Outside Fires (38.6%).