Chappaqua: Fire Incidents, New York (NY)
Where are fire incidents reported in Chappaqua, NY
Something went wrong! Please refresh the page.
|
| |||||||||||||||||||||||||||||||||||||||||||||||||||||||||||||||||||||||||||||||||||||||||||||||||||||||||||||
| Other | 67 | |||||||||||||||||||||||||||||||||||||||||||||||||||||||||||||||||||||||||||||||||||||||||||||||||||||||||||||
2002 - 2018 National Fire Incident Reporting System (NFIRS) incidents
- Incident types reported to NFIRS in Chappaqua, NY
- 1,17535.3%Hazardous Condition
- 1,10133.0%False Alarm
- 50115.0%Fire
- 2166.5%Service Call
- 1925.8%Good Intent Call
- 1223.7%Rescue & EMS
- 200.6%Overpressure Rupture
- 40.1%Severe Weather
- Fire incident types reported to NFIRS in Chappaqua, NY
- 33667.1%Structure Fires
- 9819.6%Outside Fires
- 5911.8%Mobile Property/Vehicle Fires
- 81.6%Other
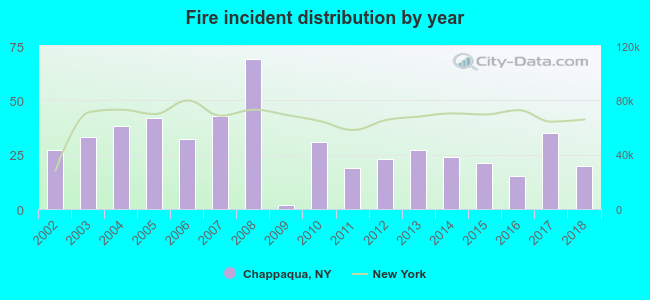 Based on the data from the years 2002 - 2018 the average number of fire incidents per year is 29. The highest number of reported fires - 69 took place in 2008, and the least - 2 in 2009. The data has a declining trend.
 The median response time based on all reported fire incidents is 5 minutes. This is higher compared to the New York median value.
The median response time in Chappaqua, NY compared to nearest cities:
(Note: Based on data for all years, including only cities with at least 500 fire incidents)
| Chappaqua: | 5 minutes |
| Bedford Hills: | 4 minutes |
| Elmsford: | 5 minutes |
| Yorktown: | 6 minutes |
| Cortlandt: | 7 minutes |
| White Plains: | 4 minutes |
| Hartsdale: | 4 minutes |
| Greenburgh: | 6 minutes |
| Greenwich: | 5 minutes |
 26.9% incidents where reported in the morning and 73.1% in the evening. The most fires (15.6%) took place on Wednesday, and the least (13.0%) on Saturday.
 Based on the 501 incident reports from years 2002 - 2018 most fires (12.4%) took place during April, and the least (5.2%) in August.
 Out of all 3,333 cases reported during the years 2002 - 2018, the most belonged to the categories: Hazardous Condition (35.3%), False Alarm (33.0%), and Fire (15.0%).
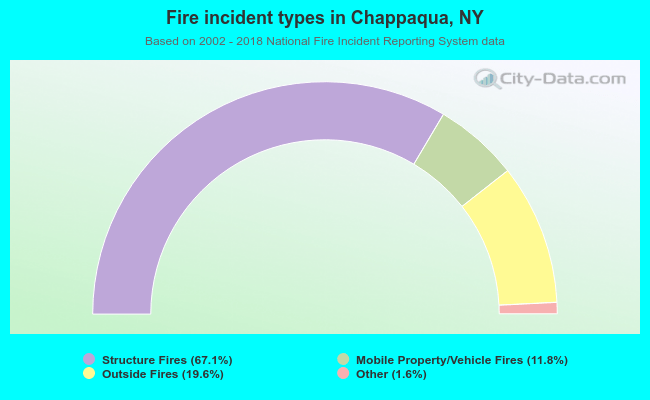 When looking into fire subcategories, the most reports belonged to: Structure Fires (67.1%), and Outside Fires (19.6%).