Cato: Fire Incidents, New York (NY)
Where are fire incidents reported in Cato, NY
Something went wrong! Please refresh the page.
|
| |||||||||||||||||||||||||||||||||||||||||||||||||||||||||||||||||||||||||||||||||||||||||||||||||||||||||||||
| Other | 54 | |||||||||||||||||||||||||||||||||||||||||||||||||||||||||||||||||||||||||||||||||||||||||||||||||||||||||||||
2002 - 2018 National Fire Incident Reporting System (NFIRS) incidents
- Incident types reported to NFIRS in Cato, NY
- 1,67559.7%Rescue & EMS
- 35212.6%Fire
- 28610.2%Hazardous Condition
- 2679.5%Good Intent Call
- 1274.5%Service Call
- 752.7%False Alarm
- 140.5%Severe Weather
- 70.2%Special Incident
- Fire incident types reported to NFIRS in Cato, NY
- 20558.2%Structure Fires
- 6518.5%Outside Fires
- 5415.3%Other
- 288.0%Mobile Property/Vehicle Fires
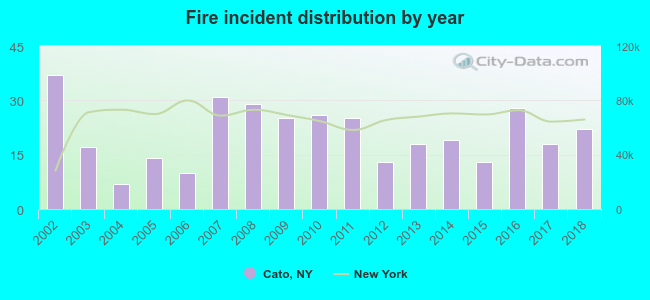 Based on the data from the years 2002 - 2018 the average number of fire incidents per year is 21. The highest number of fires - 37 took place in 2002, and the least - 7 in 2004. The data has a decreasing trend.
 34.7% incidents where reported in the morning and 65.3% in the evening. The most fires (16.5%) took place on Wednesday, and the least (11.4%) on Tuesday.
 Based on the 352 fire incidents from years 2002 - 2018 most fires (13.4%) took place during January, and the least (4.8%) in October.
 Out of all 2,804 cases reported during the years 2002 - 2018, the most belonged to the categories: Rescue & EMS (59.7%), Fire (12.6%), and Hazardous Condition (10.2%).
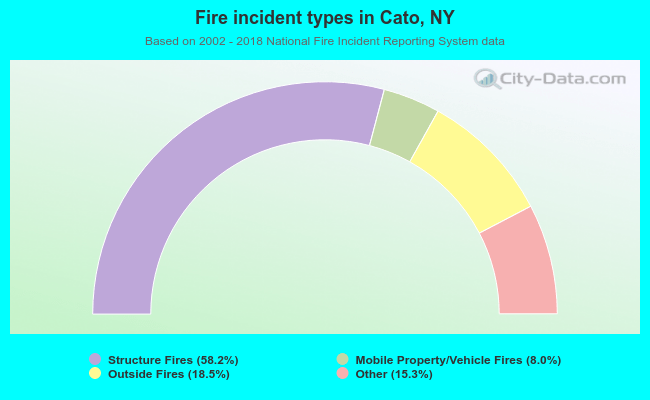 When looking into fire subcategories, the most reports belonged to: Structure Fires (58.2%), and Outside Fires (18.5%).